Benchmarking is comparing and evaluating survey results. We recently created a visualization for NSSE data comparing 1) ISU to peer institutions and 2) first-year to senior students.
The interactive visualization can be viewed by the ISU community here. A PDF is available for external audiences.
The Bottom Lines
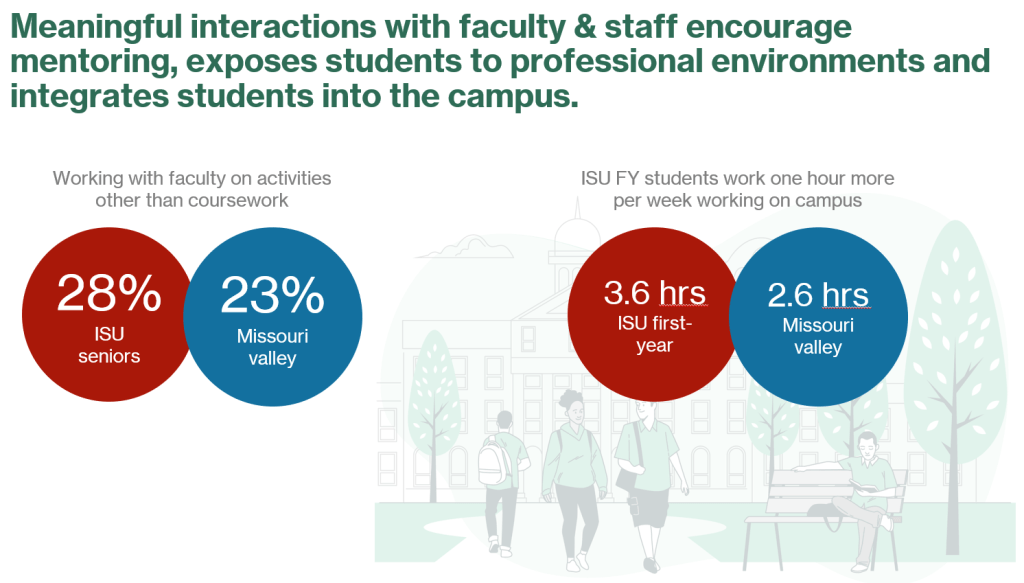
First, ISU cultivates an atmosphere that encourages involvement, fosters collaboration, and facilitates the formation of meaningful relationships.
ISU first-year and senior students are highly involved and collaborate with faculty and staff. Higher percentages of ISU students report working on campus. These are good as meaningful interactions with faculty & staff encourage mentoring, expose students to professional environments and integrate students into the campus.
However, ISU could improve by fostering an environment of belonging, enhancing academic engagement beyond the classroom, and encouraging connections between units.
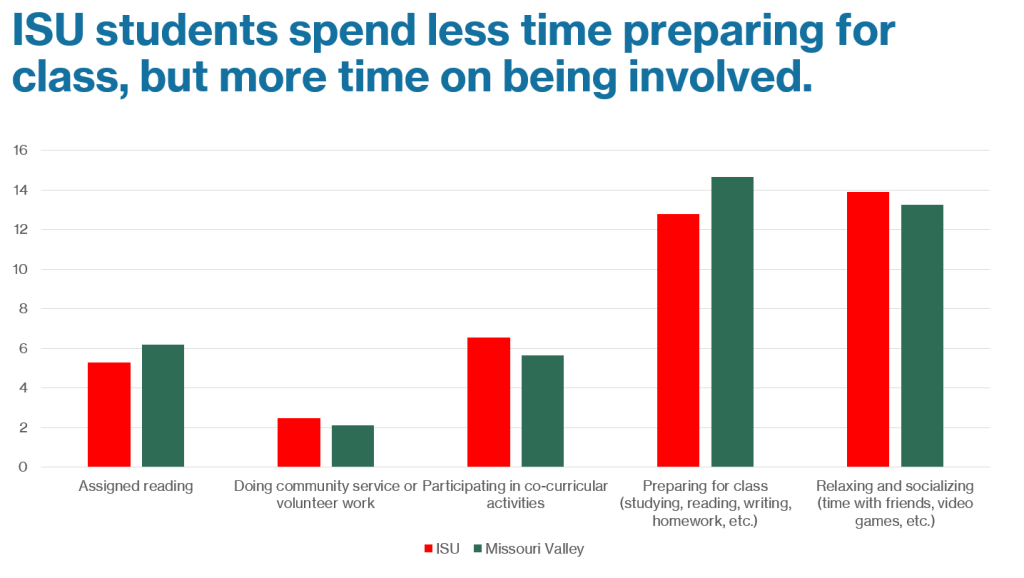
ISU students spend comparatively less time on academic preparation and studying. And respondents indicated ISU places less emphasis on it. This may not be an issue, however. Learning takes place in many venues. NSSE respondents reported significantly more working with faculty on out-of-class experiences.
The most striking differences between ISU first year and senior students were 1) sense of belonging and 2) integrative learning.
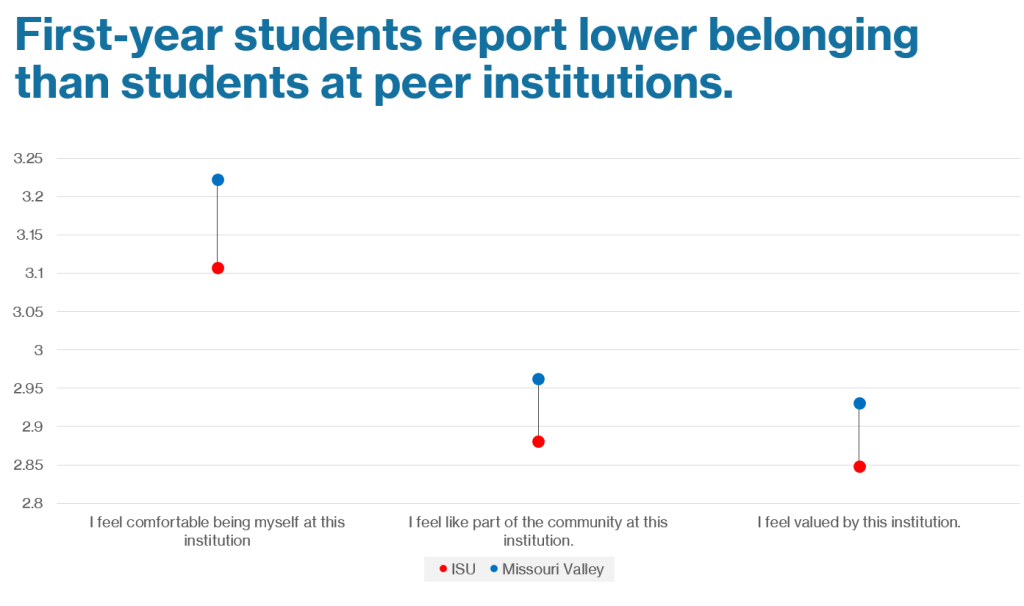
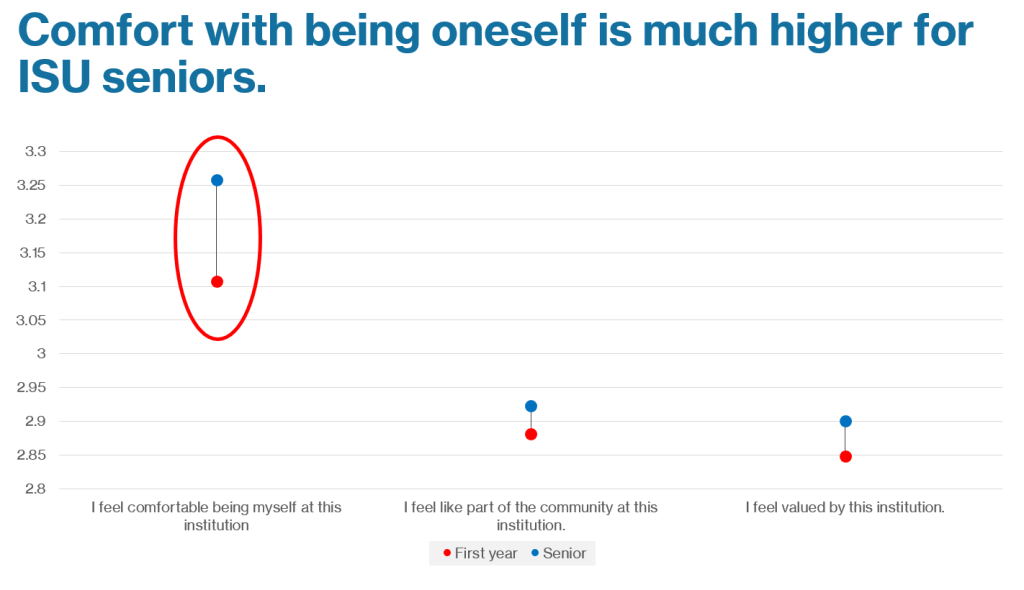
- Sense of belonging for ISU first-year students is lower than peer group averages, despite high reported levels of involvement, relationships, and collaboration. However, belonging for seniors is comparable to peer group averages. The gap in ‘feeling comfortable being oneself” is particularly high between first year and senior ISU students. This could suggest that ISU students are finding affirming spaces over time.
- Integrative learning is different for ISU first-year and senior students. First-year students integrate learning within courses, but less so across disciplines and courses. This suggests a siloed learning experience for first-year students. This could impact first-year students’ ability to address complex issues that span multiple domains.
Choose Your Journey
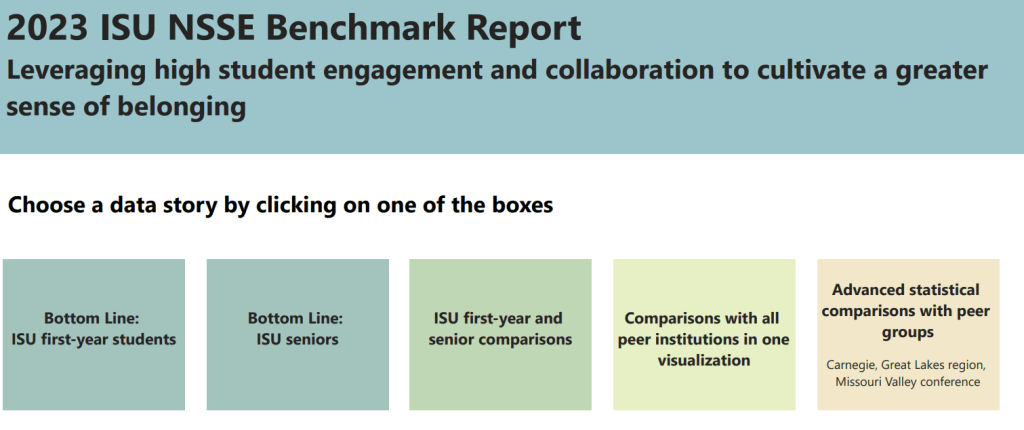
The visualization allows users to choose their journey.
- Bottom lines provide text-only summary with one data point highlighting a finding.
- First-year and senior comparisons provide average responses for each NSSE item.
- Peer comparisons allow users to compare ISU findings with peer groups.
- For the data nerds :), a table with mean differences, p-values and effect sizes are provided.