
Improving college student retention and persistence requires an empirical foundation and framework for translating research into action. That’s where assessment comes into play.
This study uses spring 2023 NSSE data and two methods to analyze college student retention at ISU: exploratory data analysis and binary logistic regression. Click here to view the data visualization. This analysis includes first-year students returners and non-returners to ISU in fall 2023.
Returning Student Profile
- Returners feel like they belong at ISU.
- Returners are engaged in interactions with others. These interactions are frequent and positive.
- Returners collaborate with other students in the classroom and in academic work outside of the classroom.
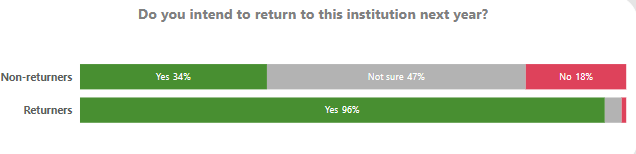
- Returning students are more certain about their decision to attend ISU and college in general.
Non-returning Student Profile
- Non-returning students feel less belonging at ISU.
- Non-returning students have less interactions with other students.
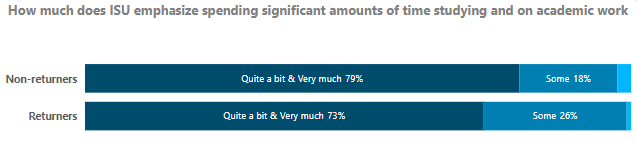
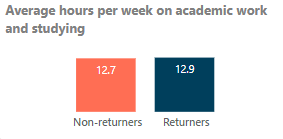
- Non-returning students exert effort and work hard. They put in as much time and effort into academic activities as returning students, including reading and writing.
- Non-returning students are less certain about their place at ISU and in college in general.
Translating Results into Action
Monitoring satisfaction and belonging could be just as important as monitoring grades and GPA
GPA is one of the, if not the most, strongest predictors of retention (not included in this model). GPA, however, is as much an indicator of academic progress as it is a signaling device to students about their place in college. Regular check-ins with students, reaffirming their decision to attend ISU, and sending targeted communications could improve retention, especially to students with low GPAs or on academic probation.
Spaces and relationships play a significant role in belonging
As the chart below shows, non-returners feel less like a part of the ISU community. These feelings may translate into doubts about students’ place in ISU or college in general. Physical spaces, on-campus jobs, affirming experiences and communicating confidence in students’ abilities to succeed can play significant roles in retention.
Students experience belonging differently. Belonging is closely tied to identity. Strategies to foster belonging should focus on systems and environments that foster sense of belonging by identity and build off students’ assets.
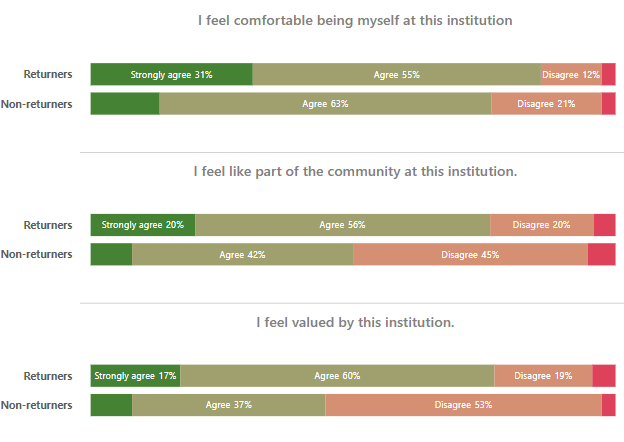
Returners are confident in their decision to be at ISU and in college in general
When students see a class or activity as relevant to life, learning, or career goals, they are much more likely to be engaged (see How College Students Succeed).
Having a clear answer to the question “when am I ever going to use this?” helps students be more confident and certain about their place in college. This has consequences for belonging and academic proficiency.
An example of this is general education. When asked about the importance of general education outcomes, students respond in the positive. When asked about general education courses, however, students express a lack of interest. This gap between outcomes and courses reflects a lack of relevance to students. Clarifying the relevance of college to potential non-returners could improve retention.

Teaching students how to collaborate and interact with others
About half of non-returners felt ISU contributed to their teamwork skills, compared over 70% of returners. Non-returners are also less likely to collaborate with others students on academic work and report less positive interactions with other students. Teaching students who lack the skills or confidence to interact with others could have a positive impact on retention.
Compared to peer institutions, ISU seniors report highly positive interactions with faculty, staff and students. This suggests ISU does foster positive interactions beyond the first year.
This may seem like a blueprint for extroverts. But I don’t think so. The data told me that belonging is about students finding their place as much as it is about the signals they get from their environment.
Non-returners work hard at pretty much everything, especially working off-campus
Non-returners get it: academic success takes effort. In addition to studying, non-returners do more writing and reading outside of class than returners.
Potential non-returners may respond well to expressions of confidence in their ability to succeed and being challenged. In addition to teaching collaboration and teamwork, emphasizing learning strategies outside of class could enhance retention.
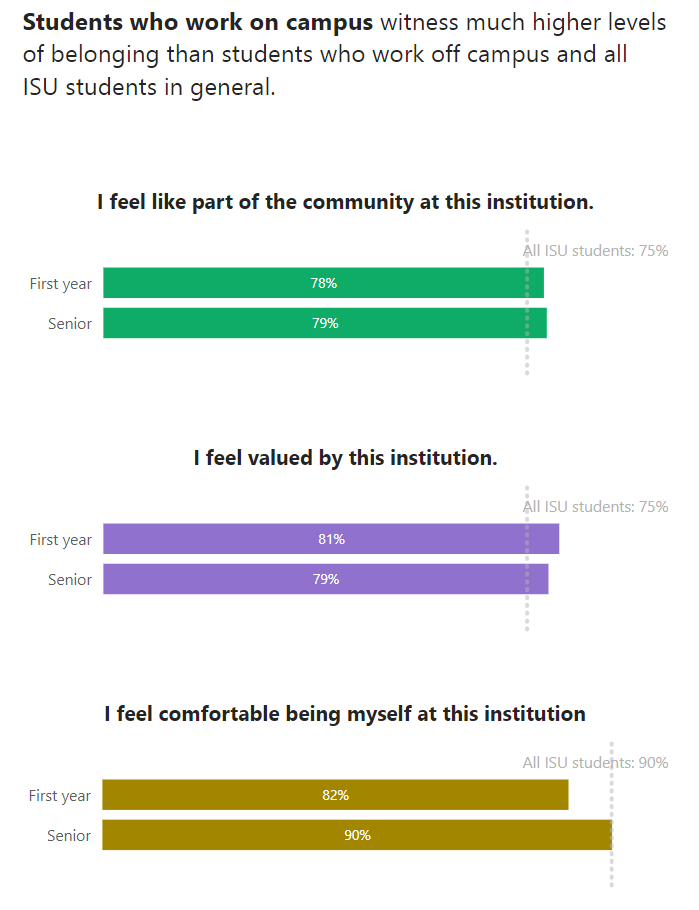
Working off-campus is a tough one. Many of the non-returners who worked off-campus probably have financial need. Not only does working off-campus take time, it pulls students away from engagement on campus. Our analysis at ISU shows that students who work on-campus witness higher sense of belonging.
The idea of the unmotivated “college drop out” is probably not warranted for all non-returners. There is only so much time in a day. Non-returners may simply run out of time.
Assessment data, visualizations and methodologies
This project employed two methods:
- Exploratory data analysis.
- Binary logistic regression.
Exploratory data analysis (EDA) is a descriptive process of summarizing and categorizing data for trends and patterns.
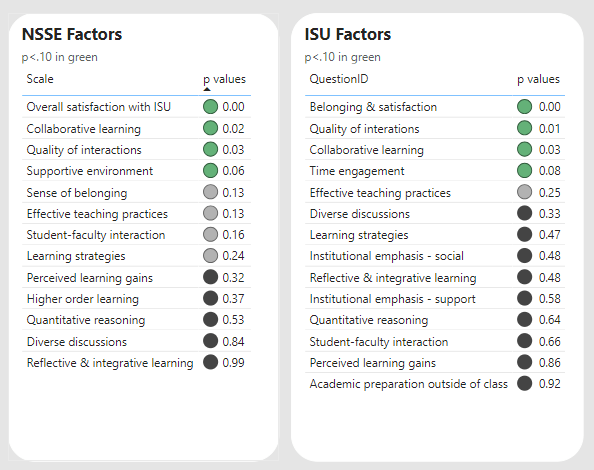
Binary logistic regression was selected because the outcome is dichotomous: either first-year students returned or they did not. Two analyses were conducted, one with NSSE factors and the other with ISU factors. These are the covariates or independent variables. The NSSE factors are based on engagement indicators created by the Indiana University Center for Postsecondary Research. These are combinations of the survey questions converted to scales. A factor analysis was employed to create ISU factors. The ISU factors were very similar to the NSSE factors.
Both models worked well, although they were better at determining the probability of returners than non-returners. In both models, the chi-square significance was p<.000. The p-values for the scales are below.
Differences between EDA and logistic regression
I conducted the EDA first. I have also been working closely with the NSSE data for approximately a year. I definitely feel like I know our students!
The regression results were not very surprising, but the analysis did help me see a few things I probably would have missed by exclusively doing EDA.
