
Overview of Hto lines
| Insert name & target gene | Gene product notes | Eye & wing phenotypes | Other |
|---|---|---|---|
| BRO. cut. | homeobox transcription factor | 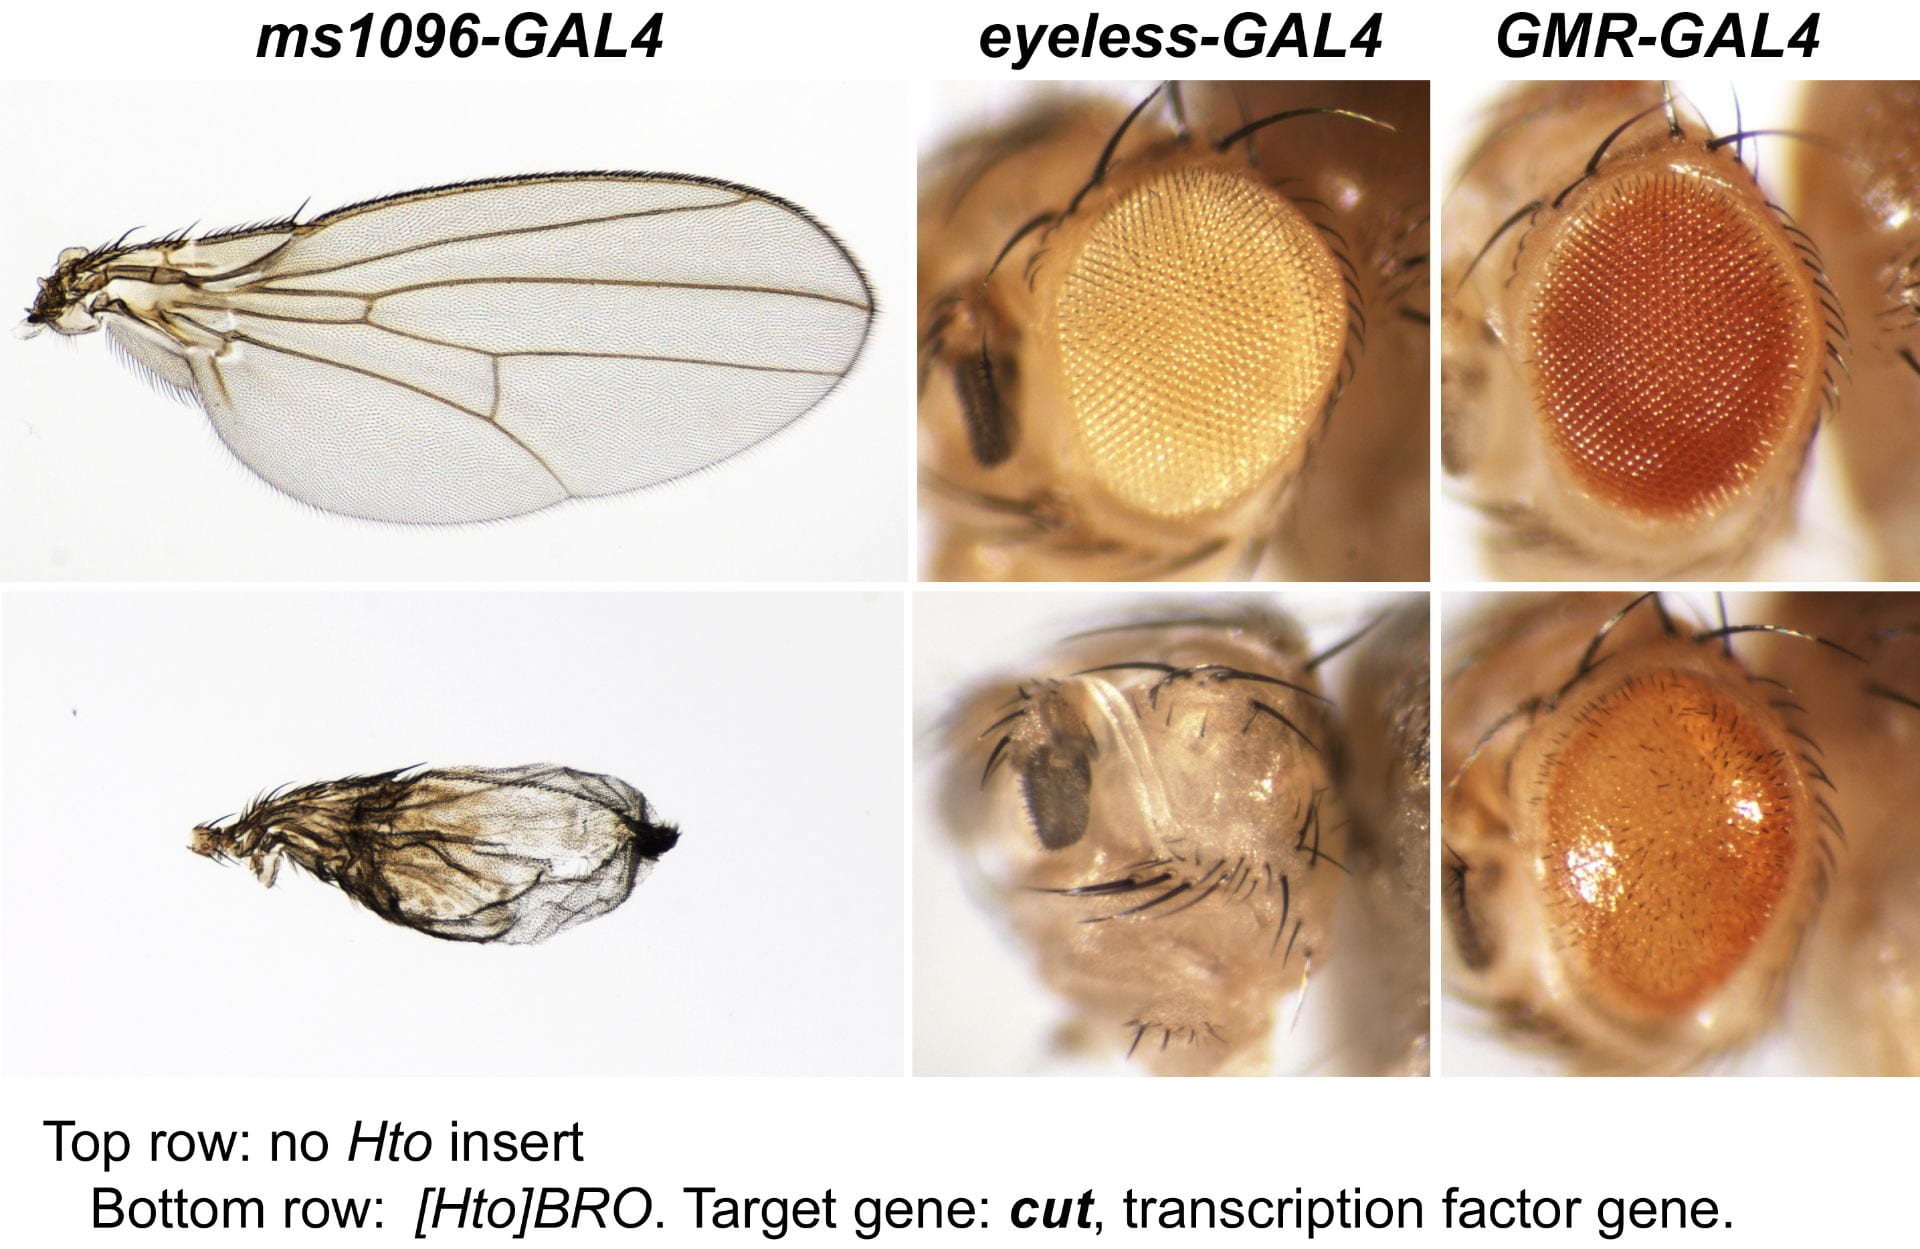 | |
| CXM. lethal(1)G0232. | nonreceptor tyrosine phosphatase Meg2 | 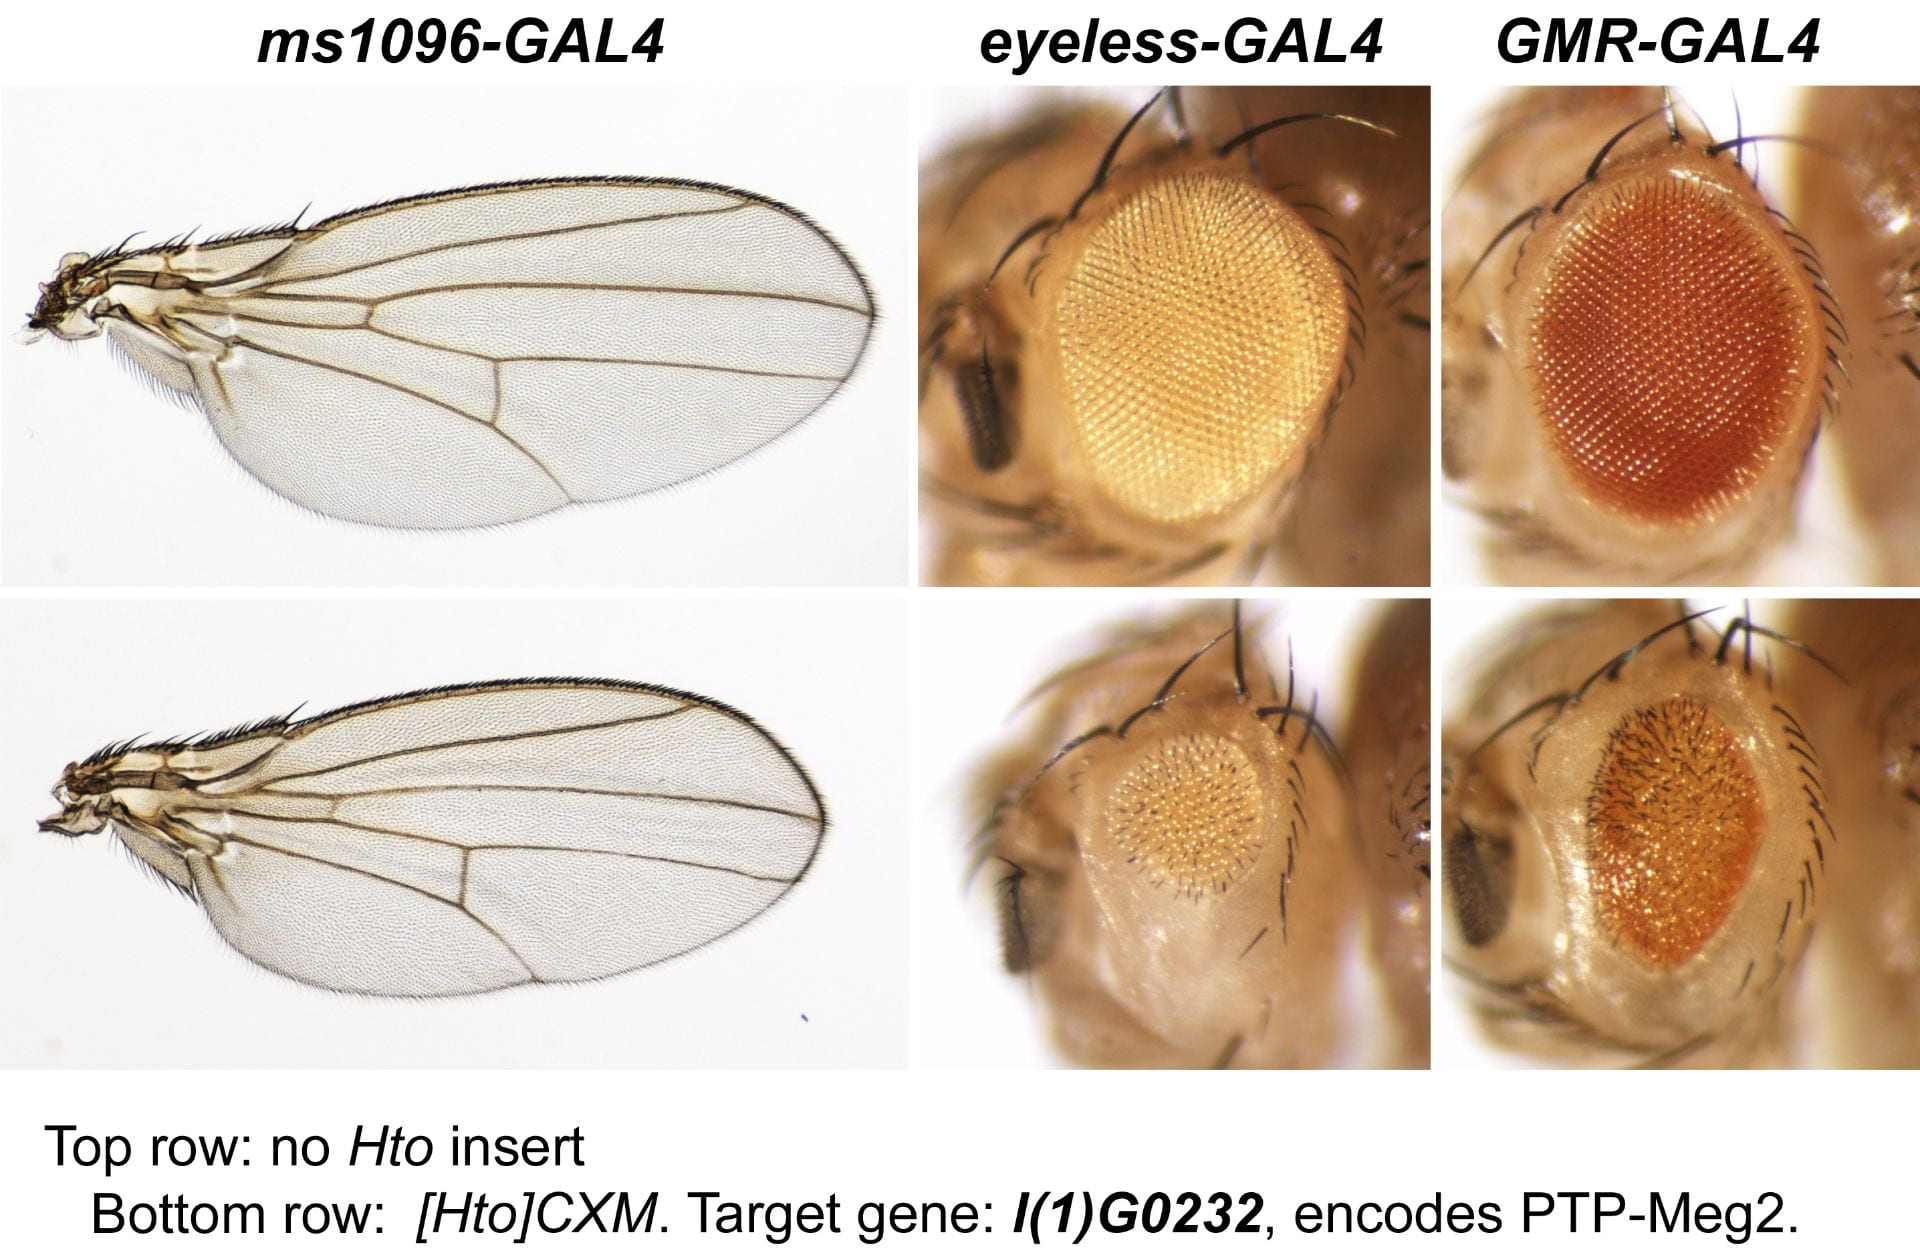 | |
| KPF. CG11122. | Zn finger protein |  | 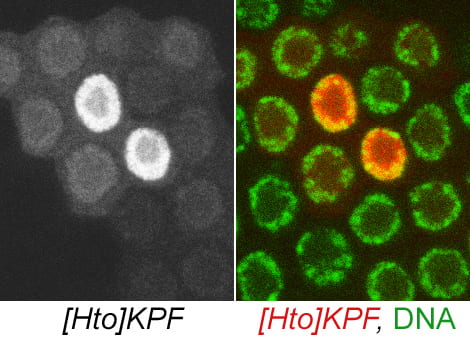 |
| GND. mamo. | Zn finger protein similar to Hum. ZNF121 | 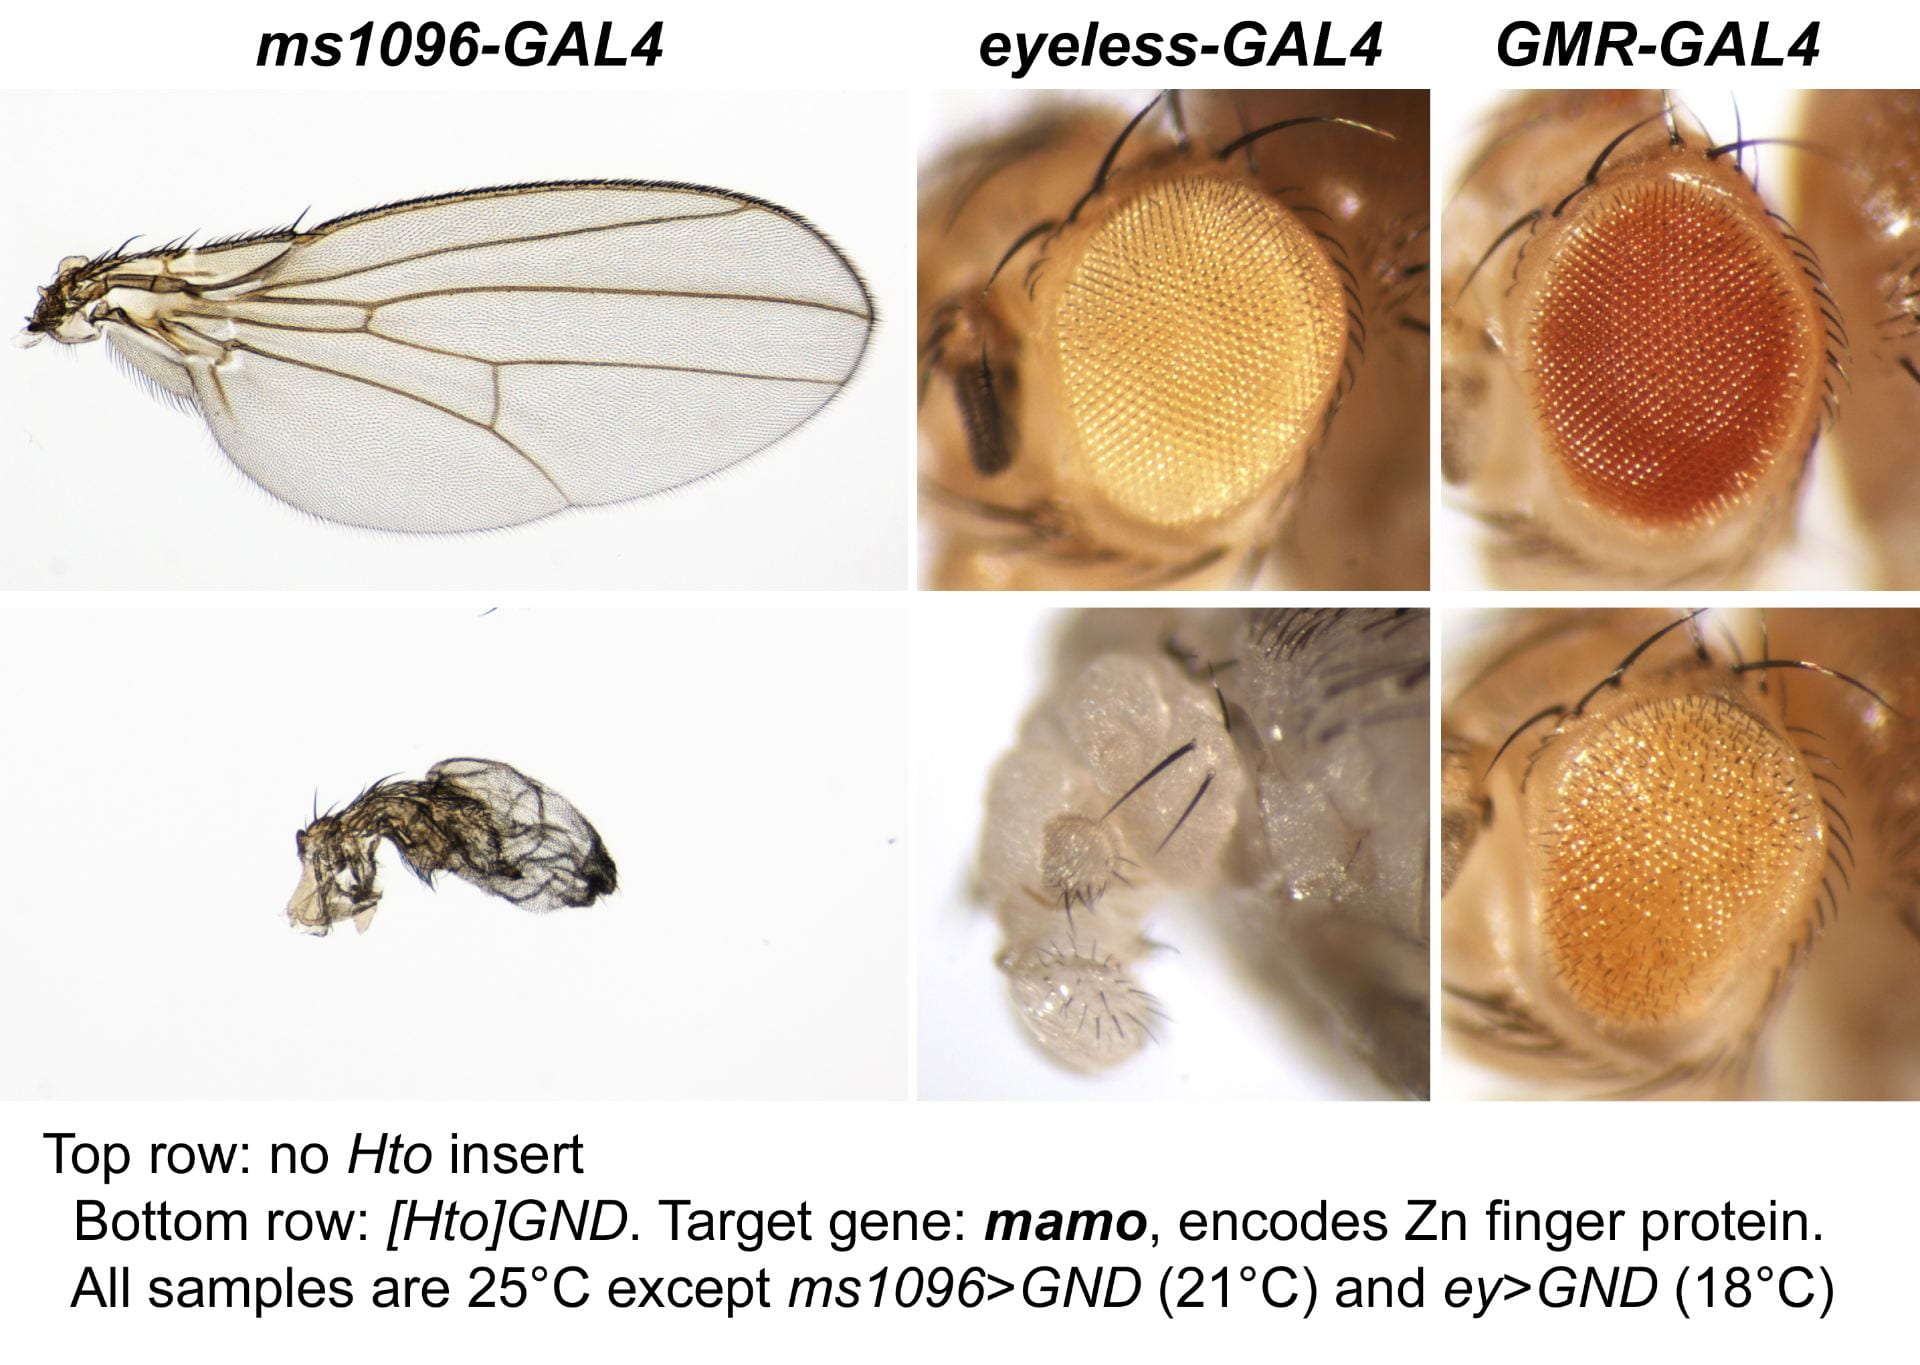 |  |
| GLO. CG34340. | homeobox transcription factor | | |
| DRE. elbow B | transcription factor | 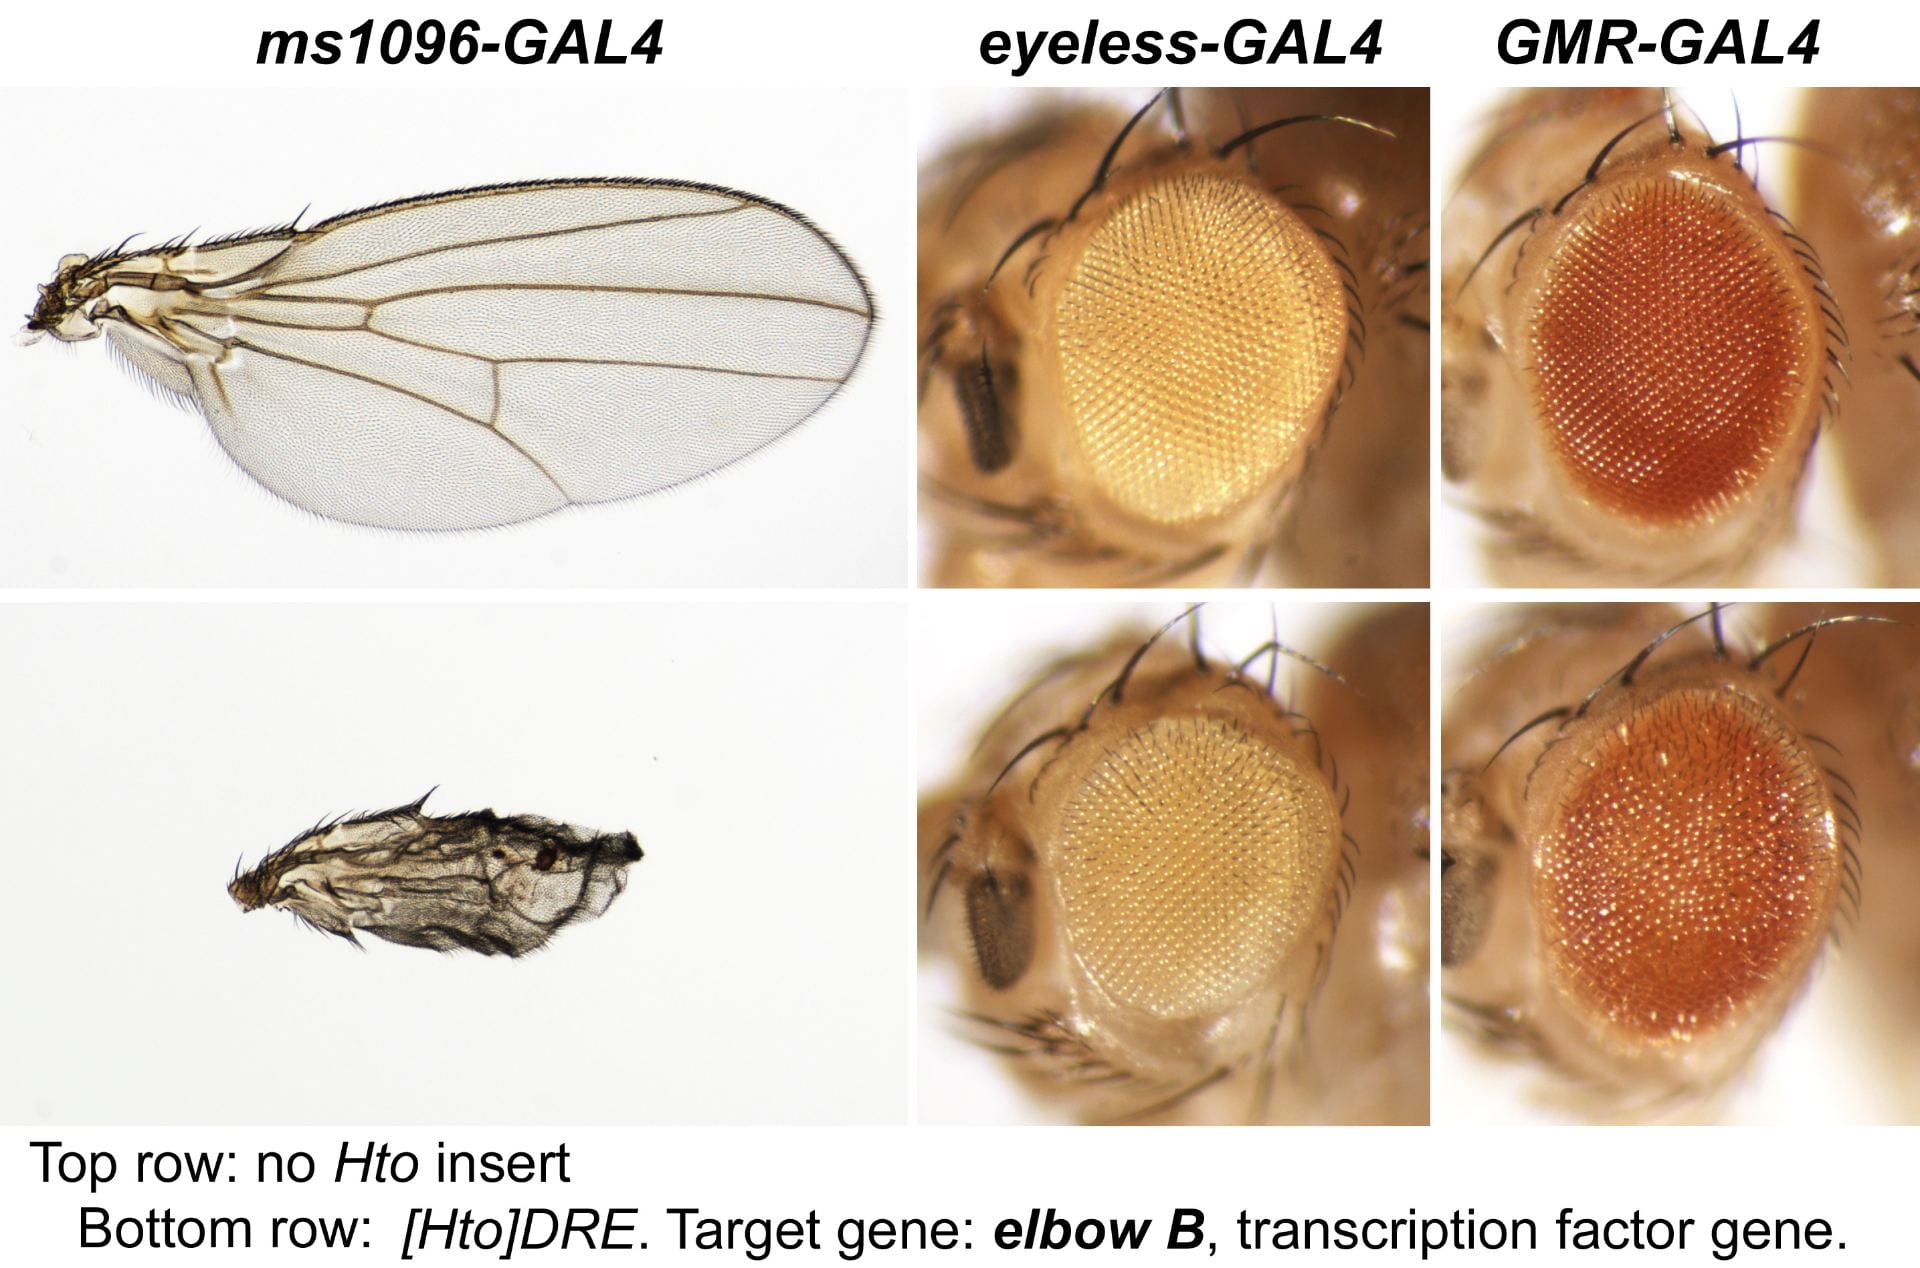 |  |
| POV. vestigial. | Transcription cofactor for Sd | 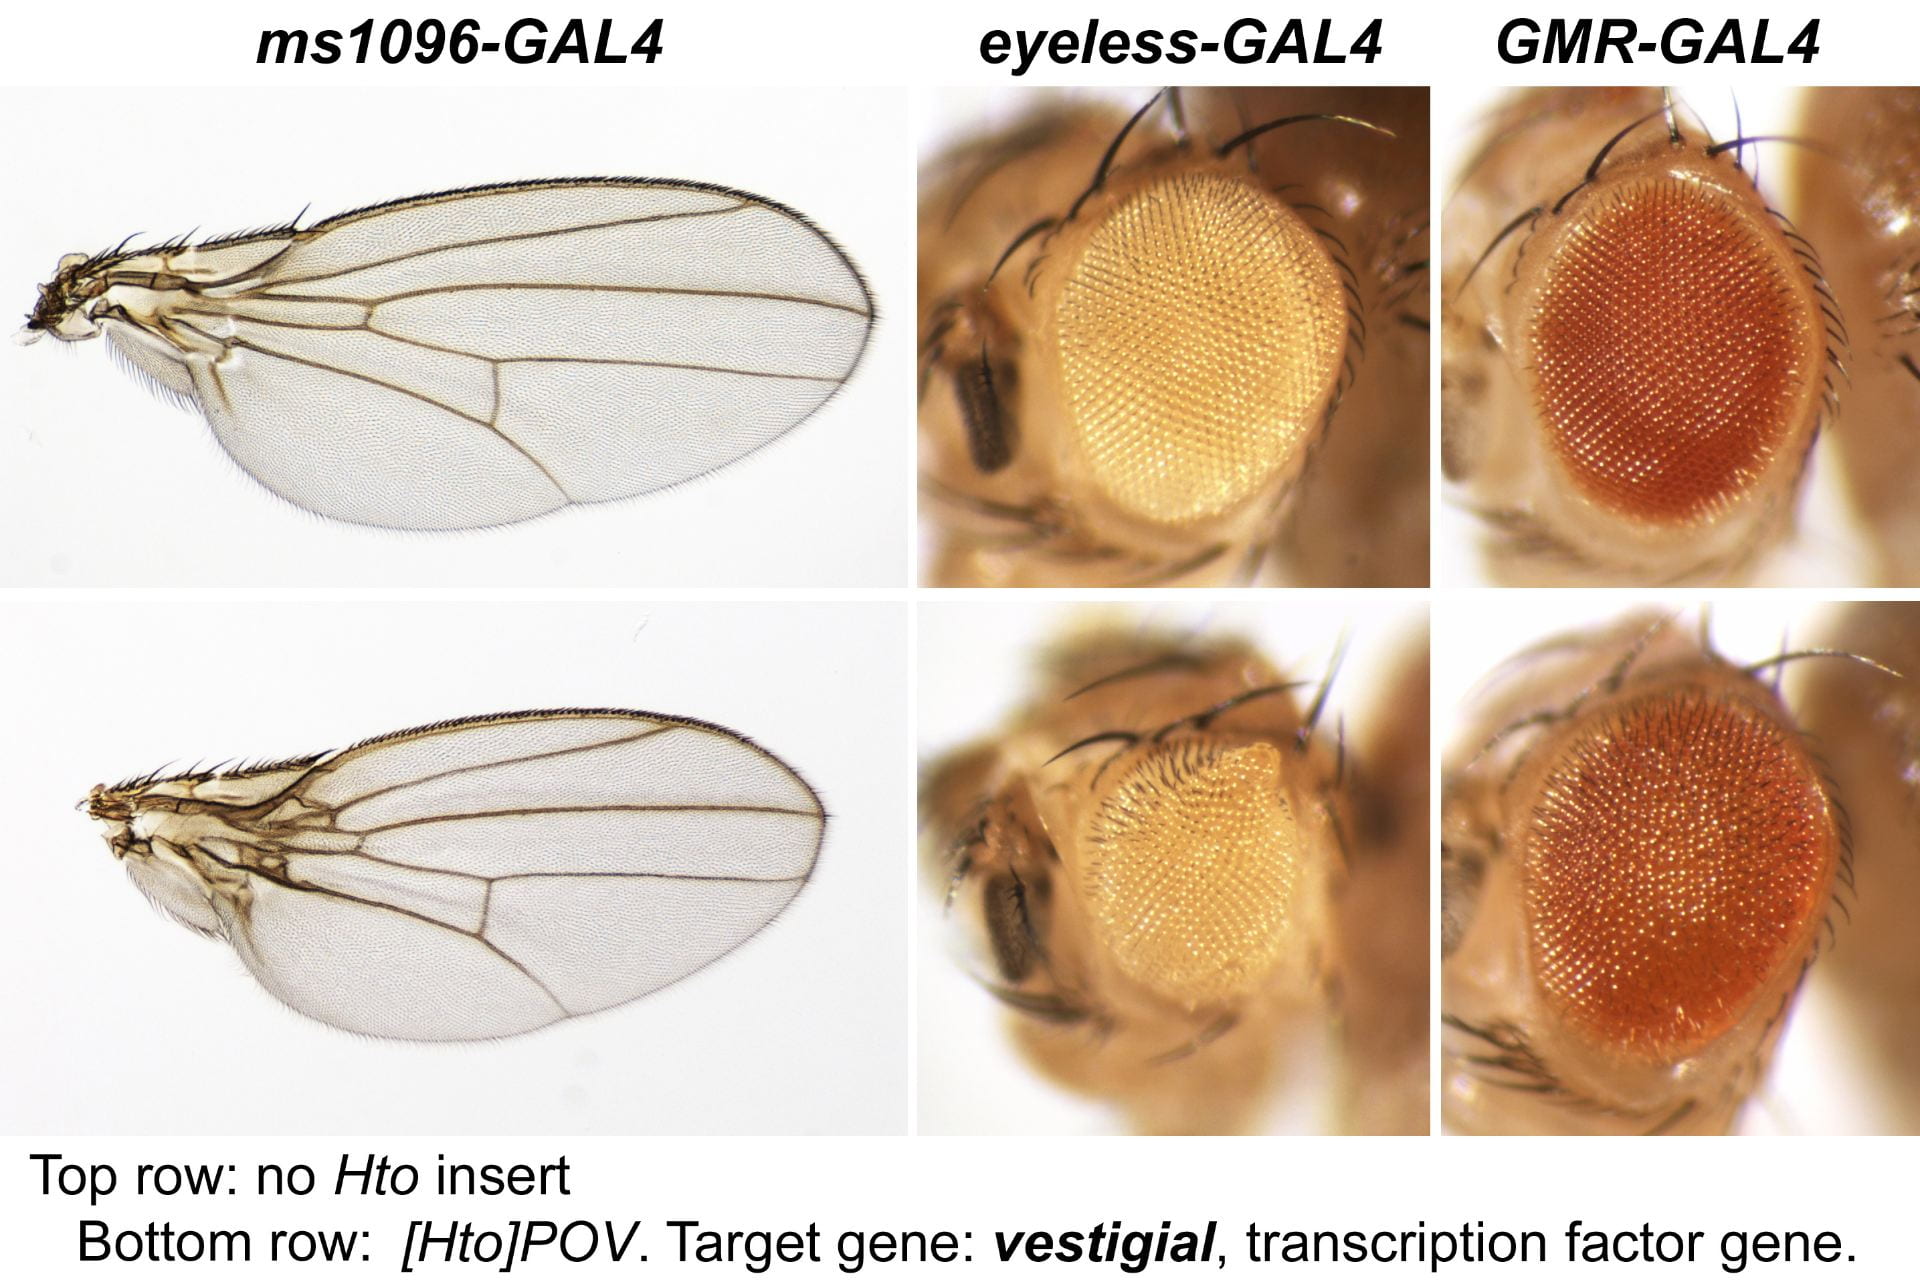 | |
| REM. mastermind. | Transcription cofactor for Notch | 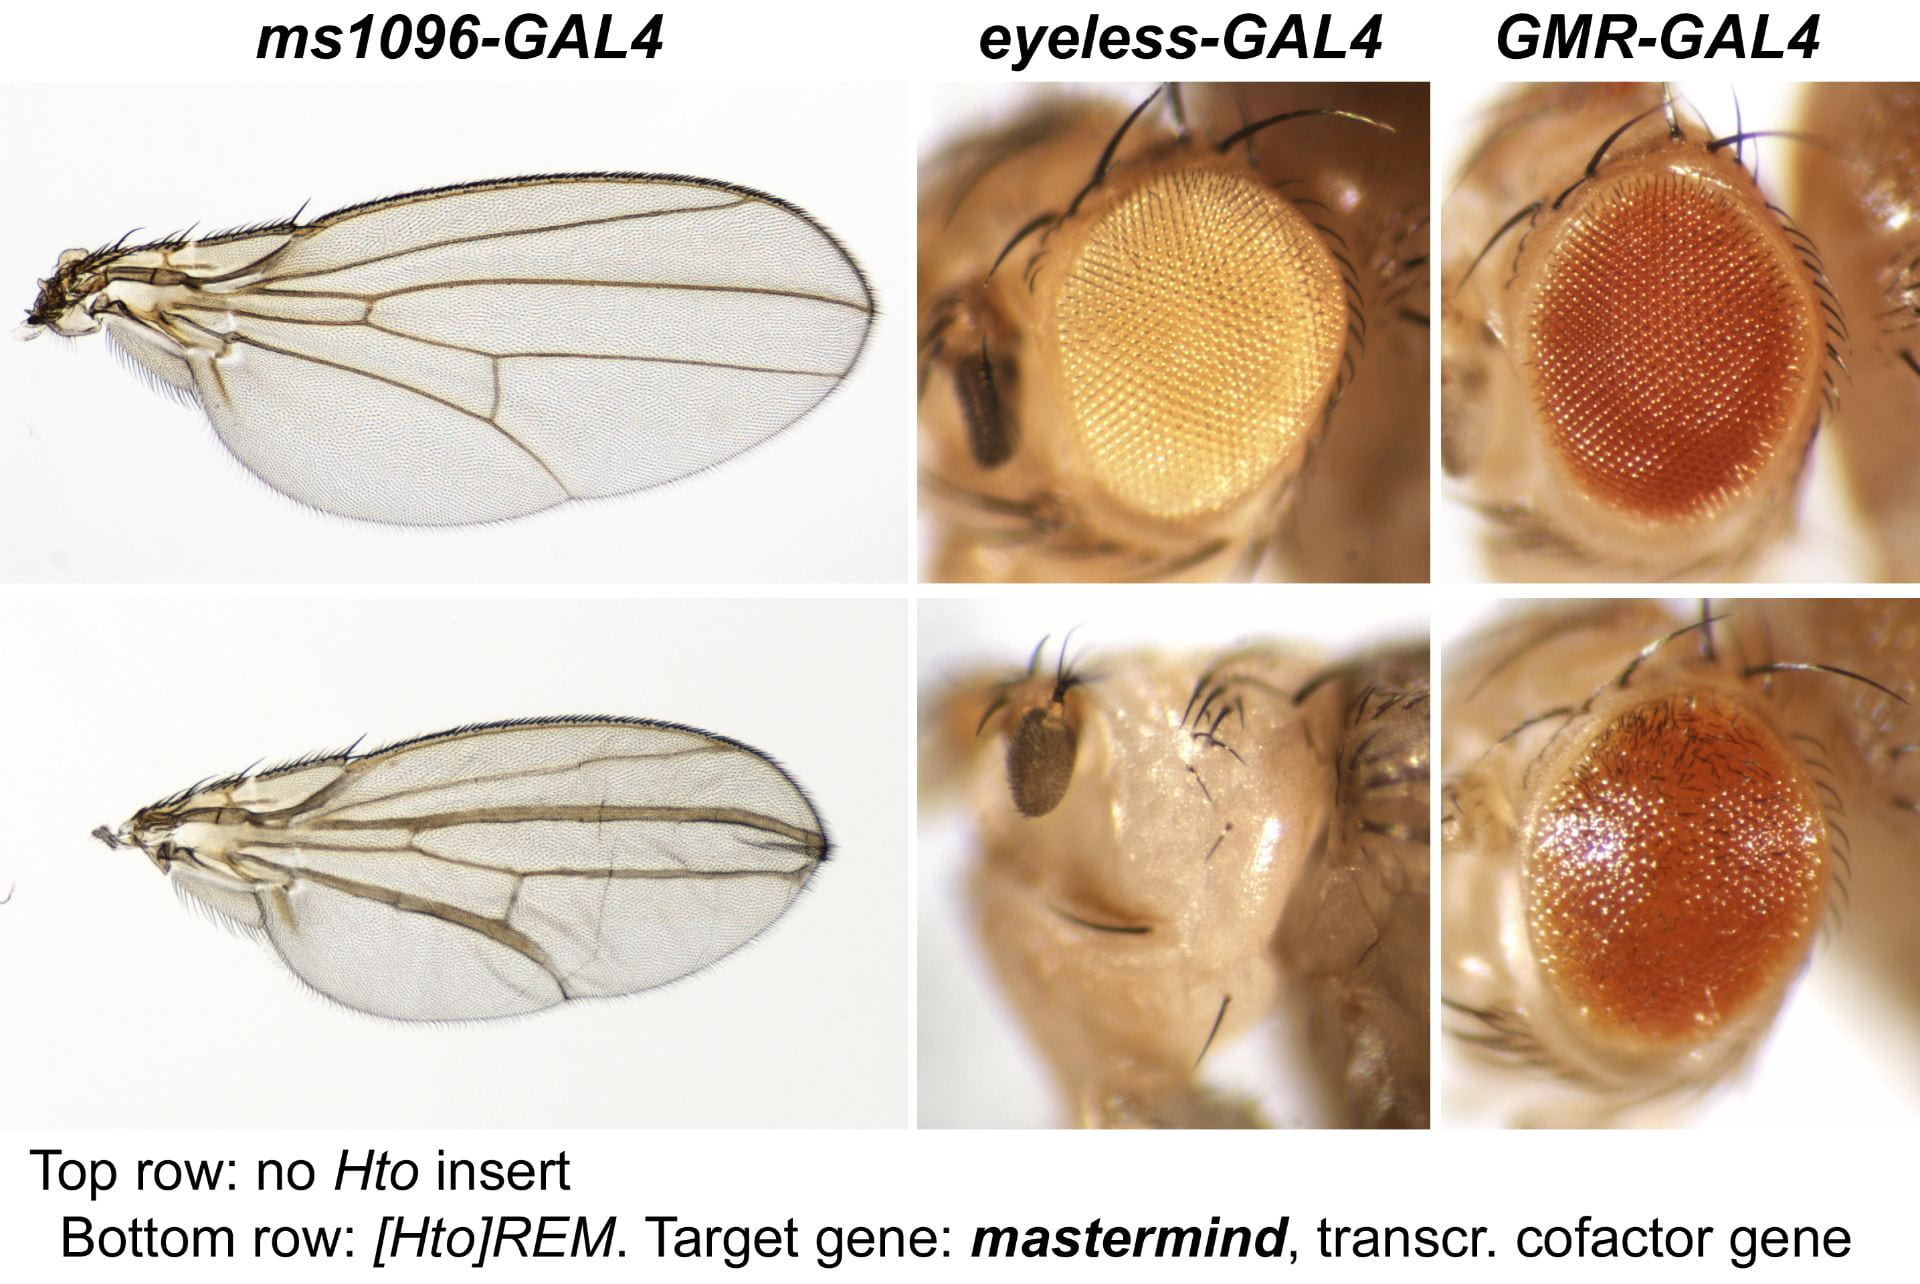 | insert on SM6 balancer |
| HEM. Not localized; Probably mastermind. | | 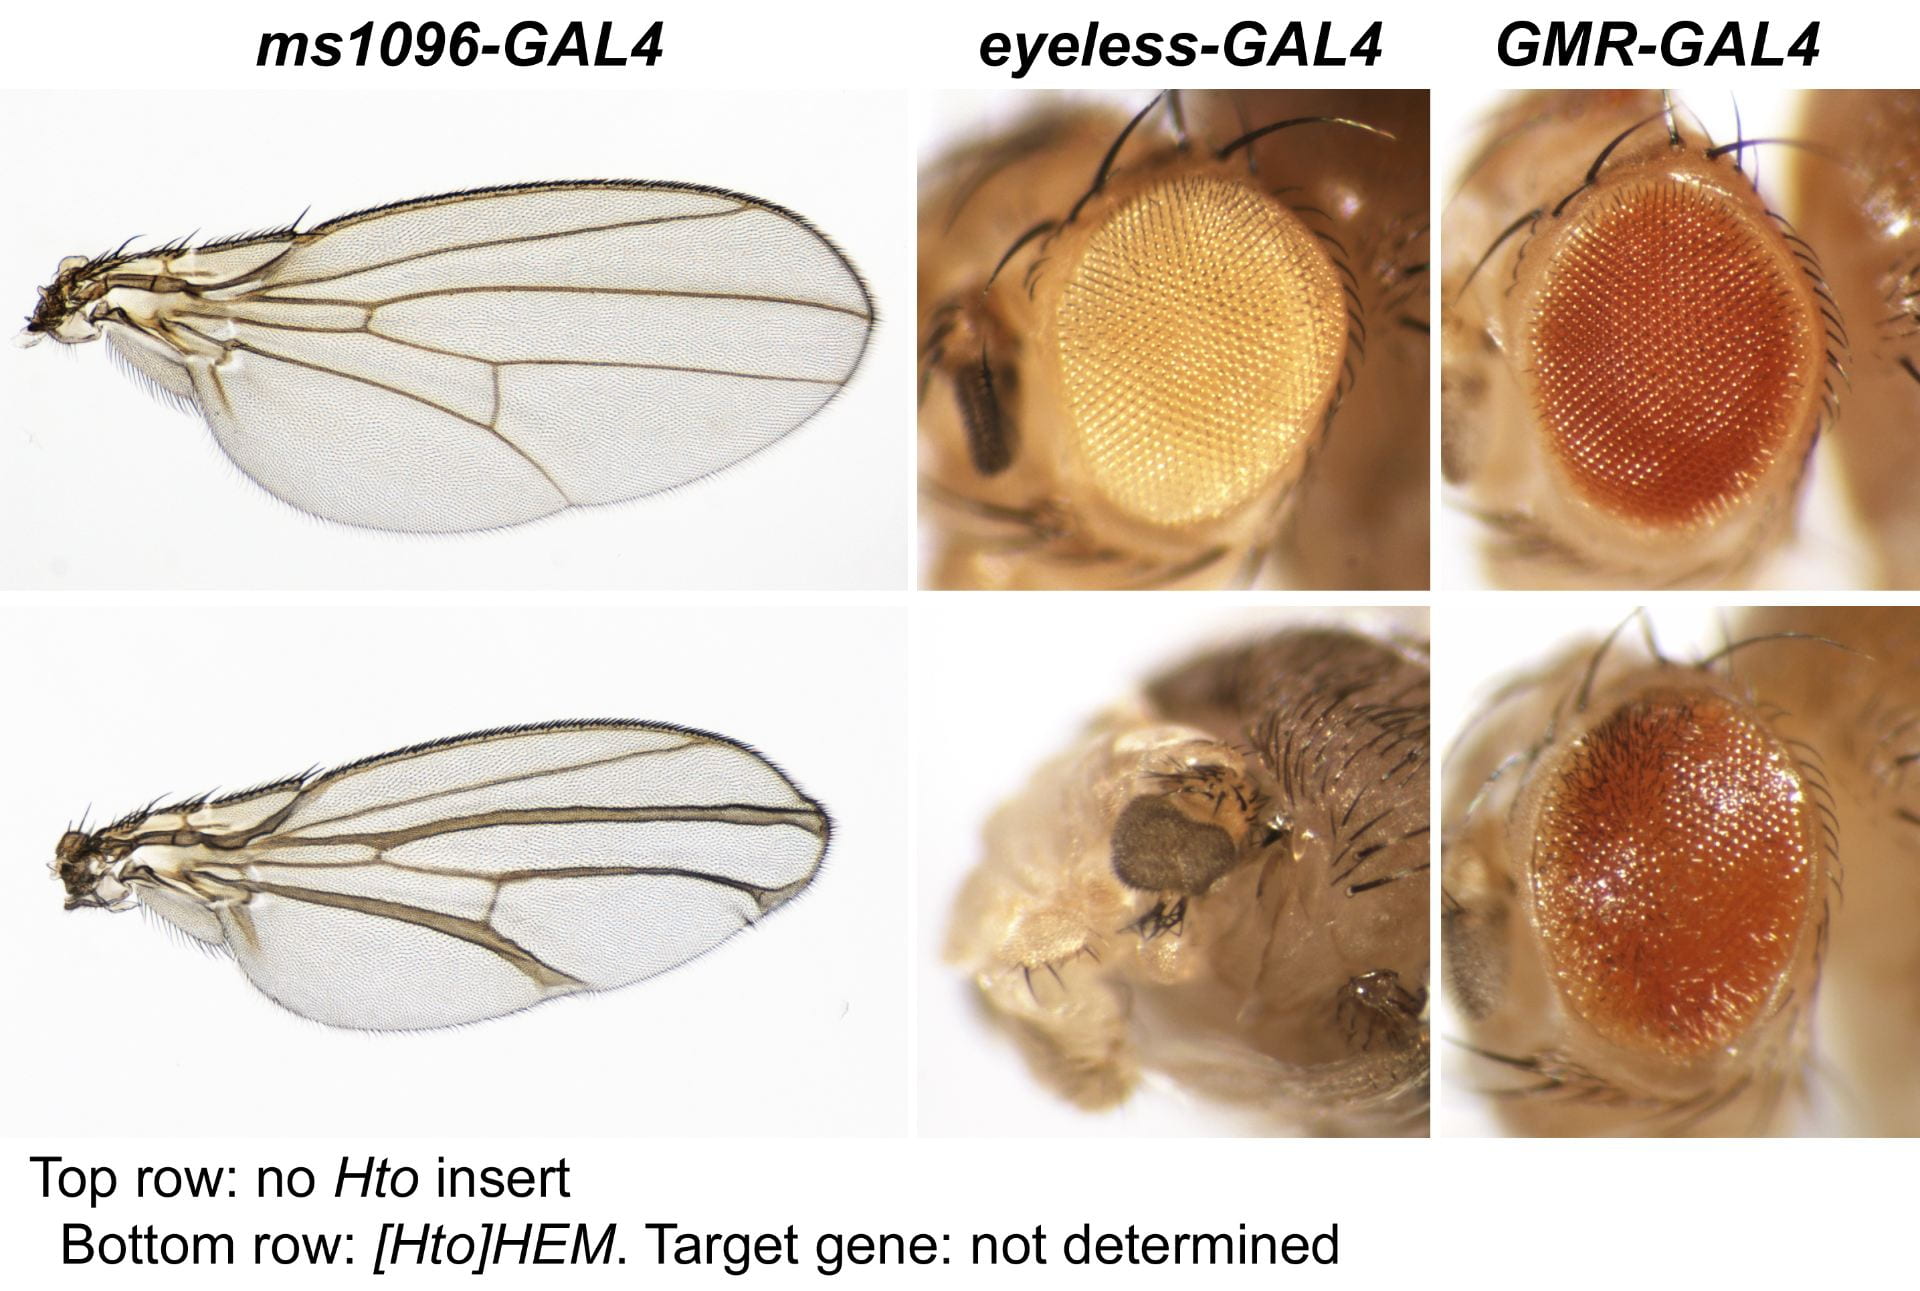 | Insert not on balancer |
| WRS. seizure. | 6-TM K+ channel | 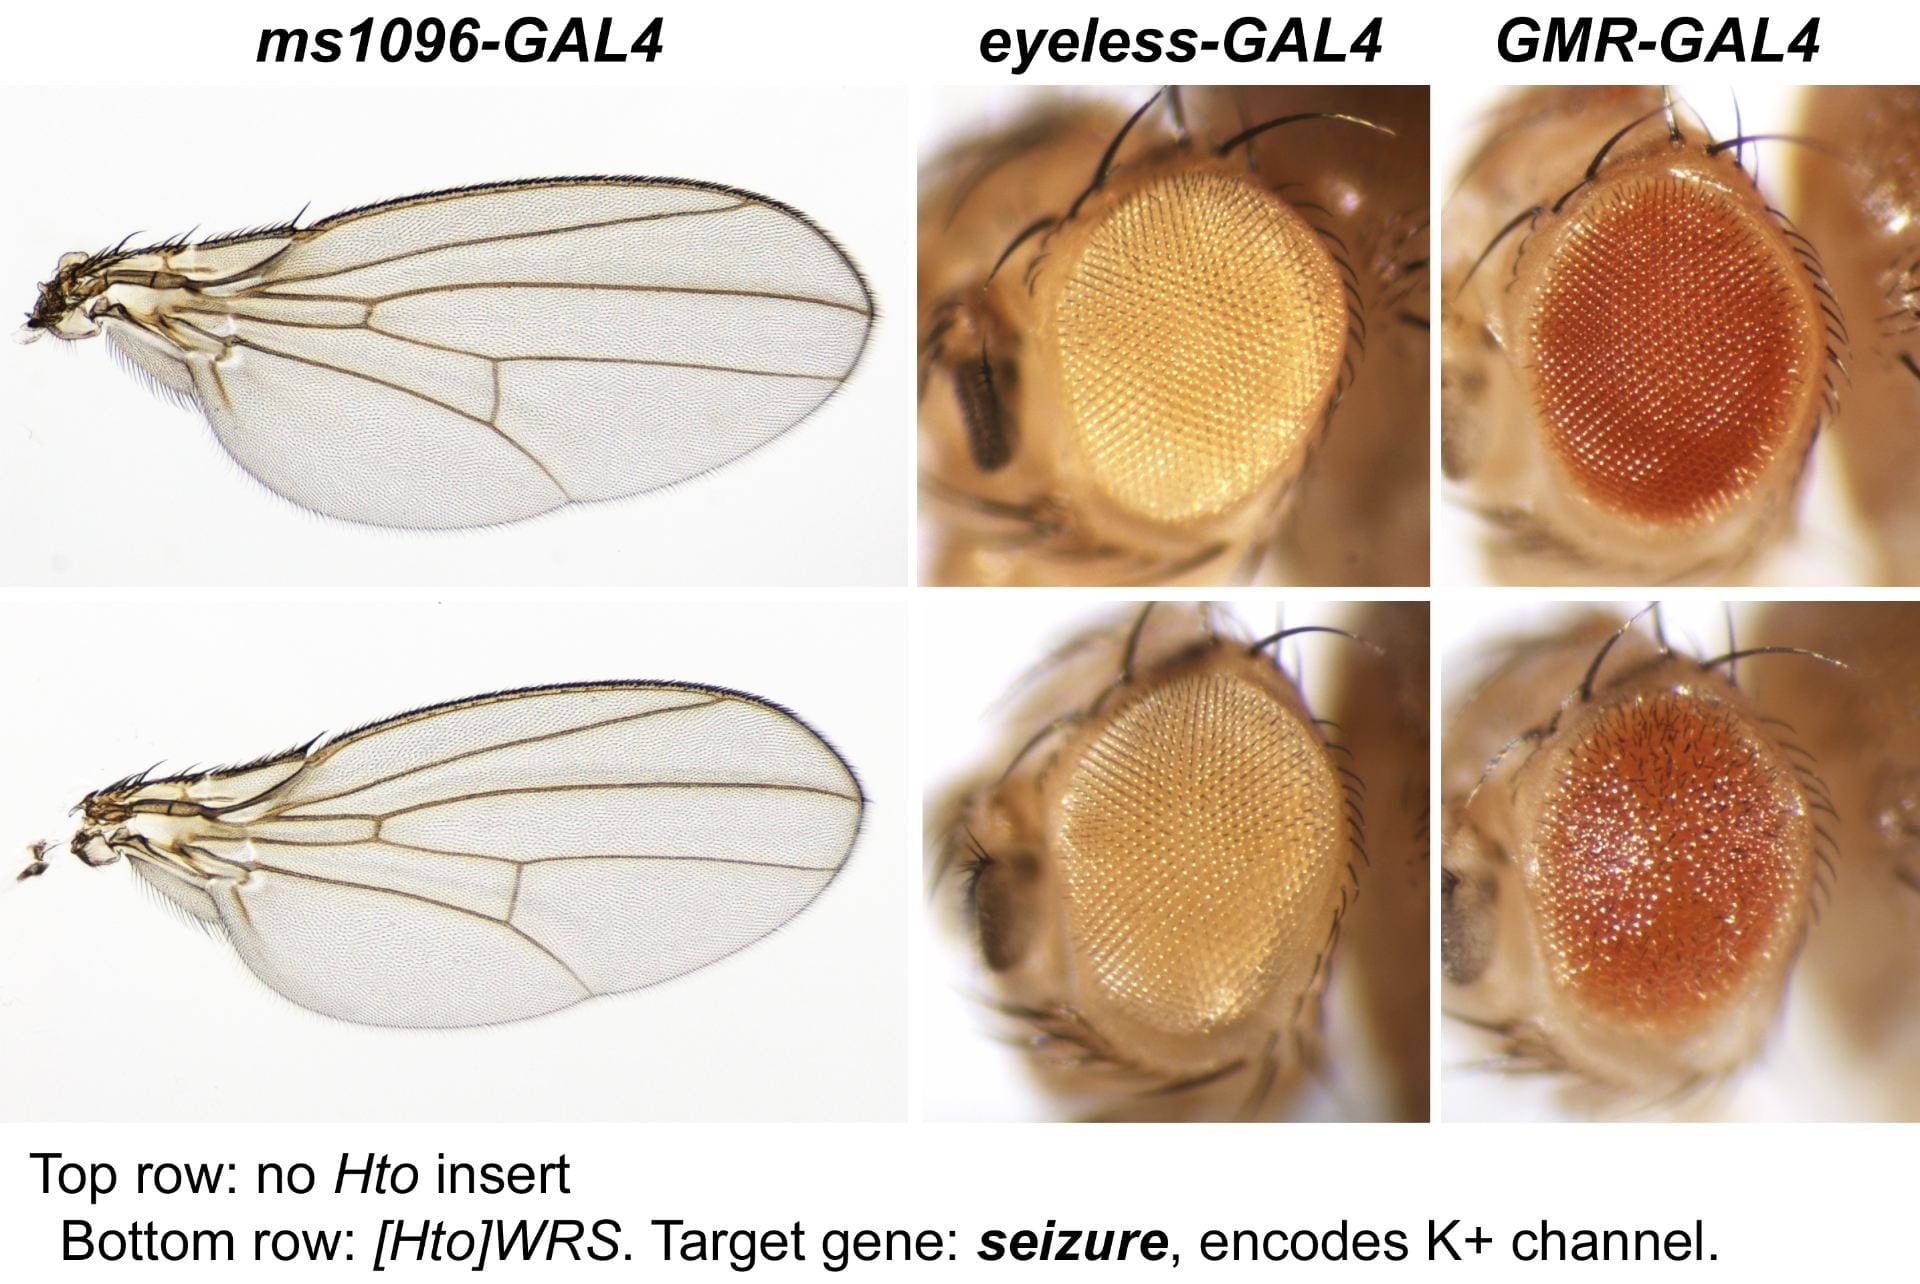 | |
| QSR. kahuli/ CG17181. | Snail family transcription factor | 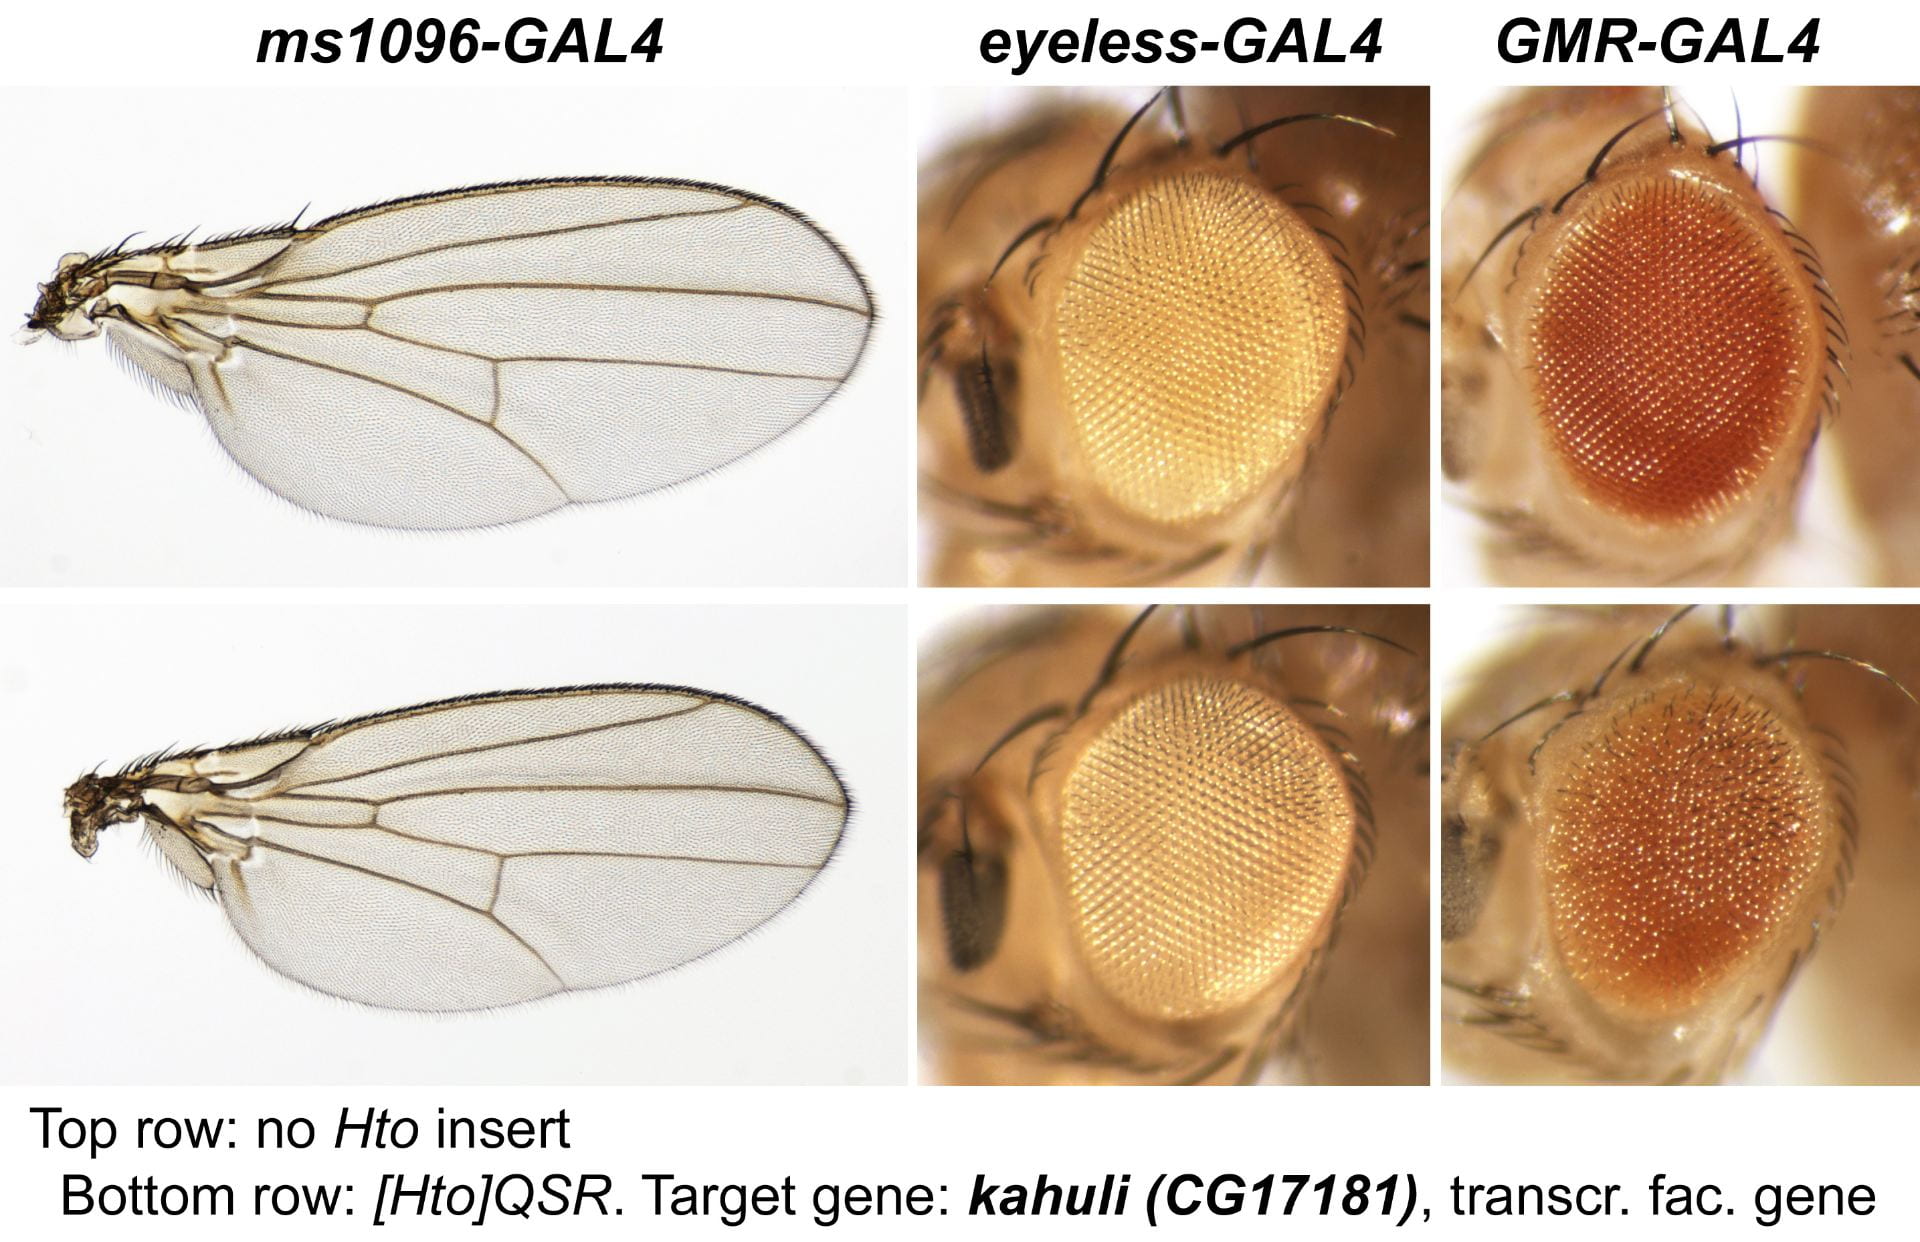 | |
| XTC. klumpfuss. | transcription factor |  |  |
| SMH. mir-274. | microRNA |  | |
| FAR. araucan. | homeobox transcription factor | 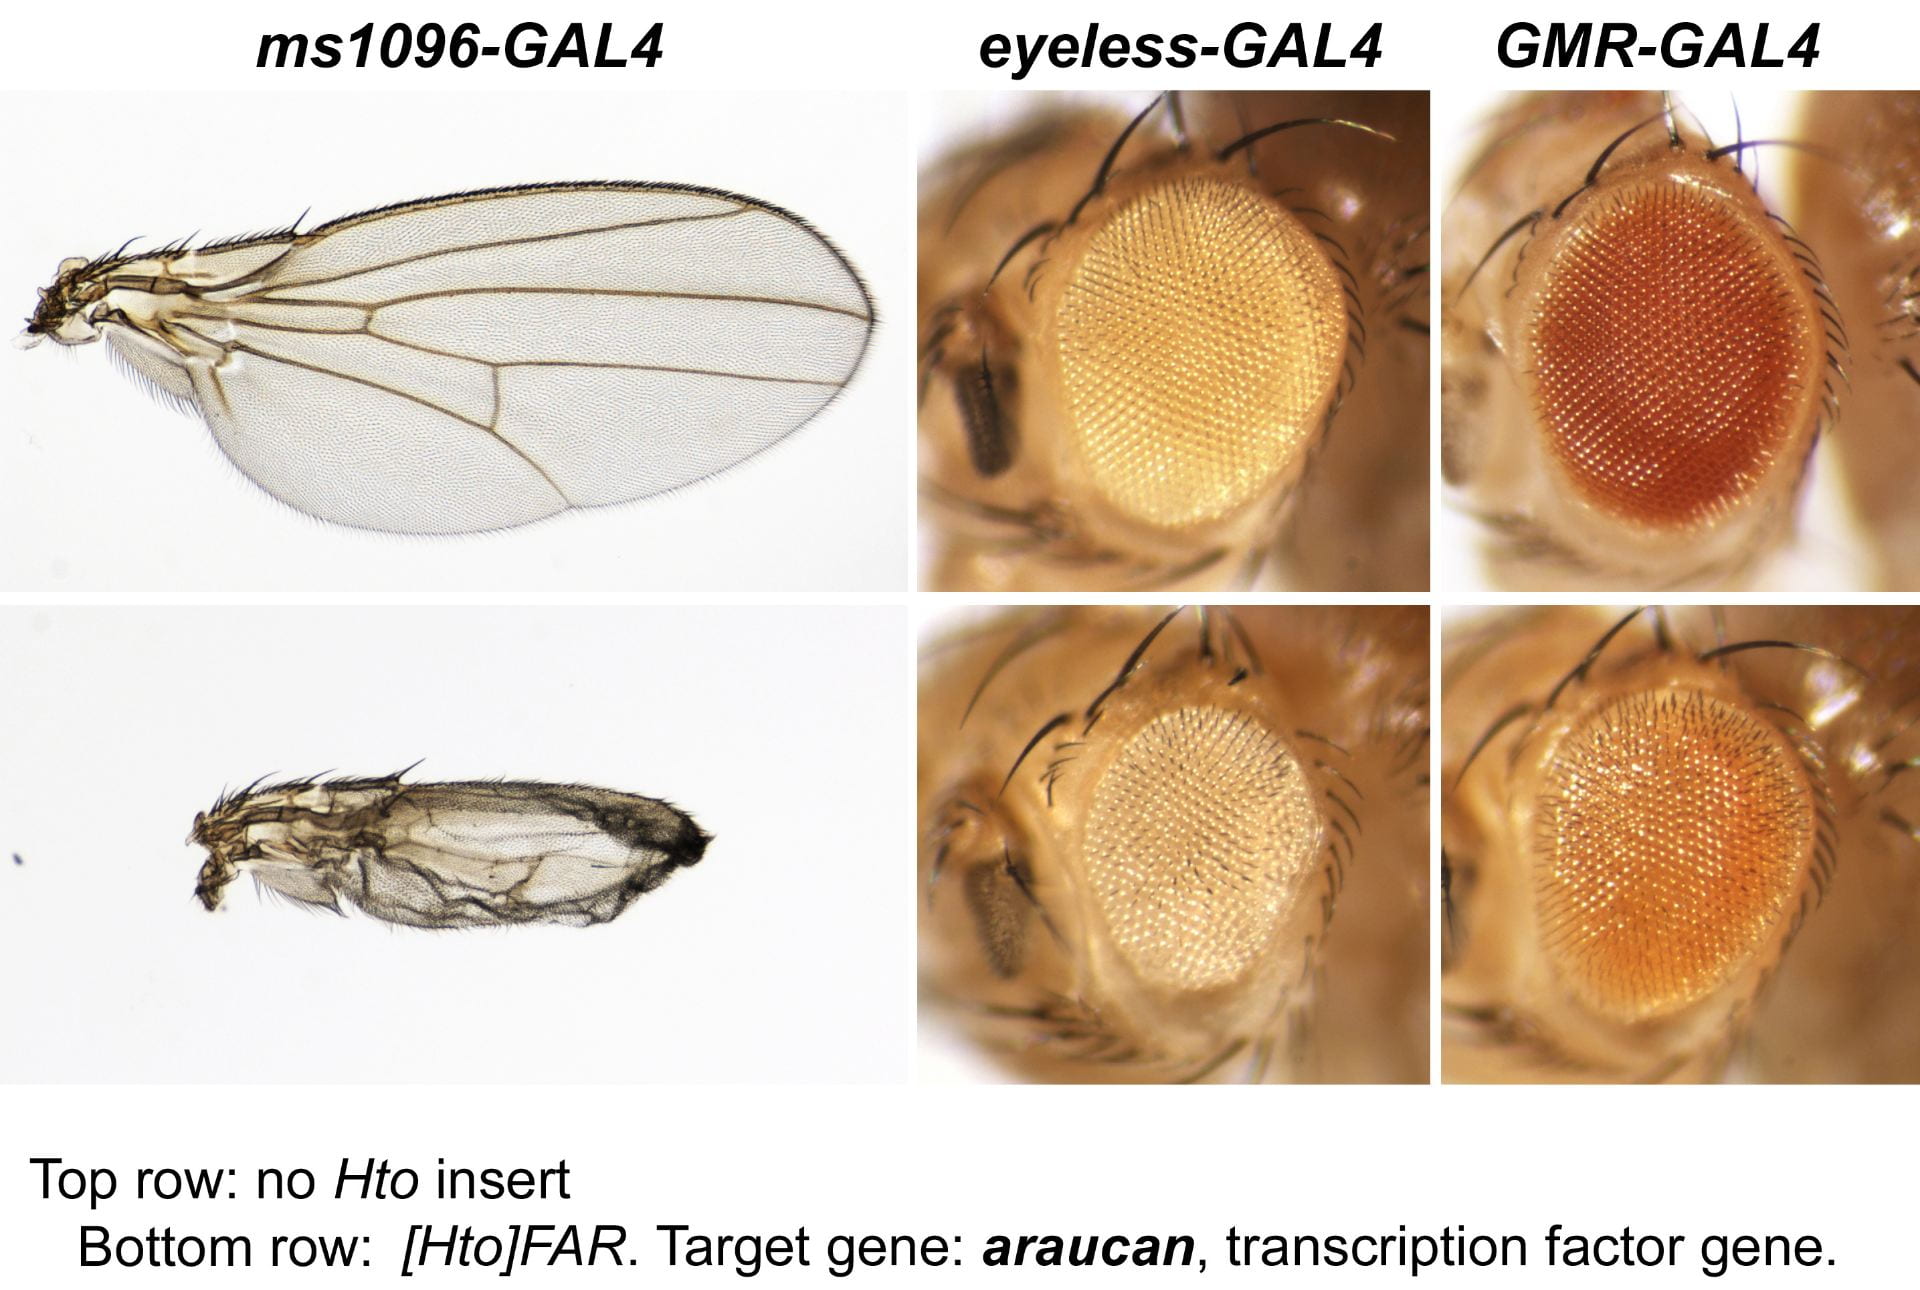 | |
| BRW. nuclear fallout. | RAB11-FIP3 | 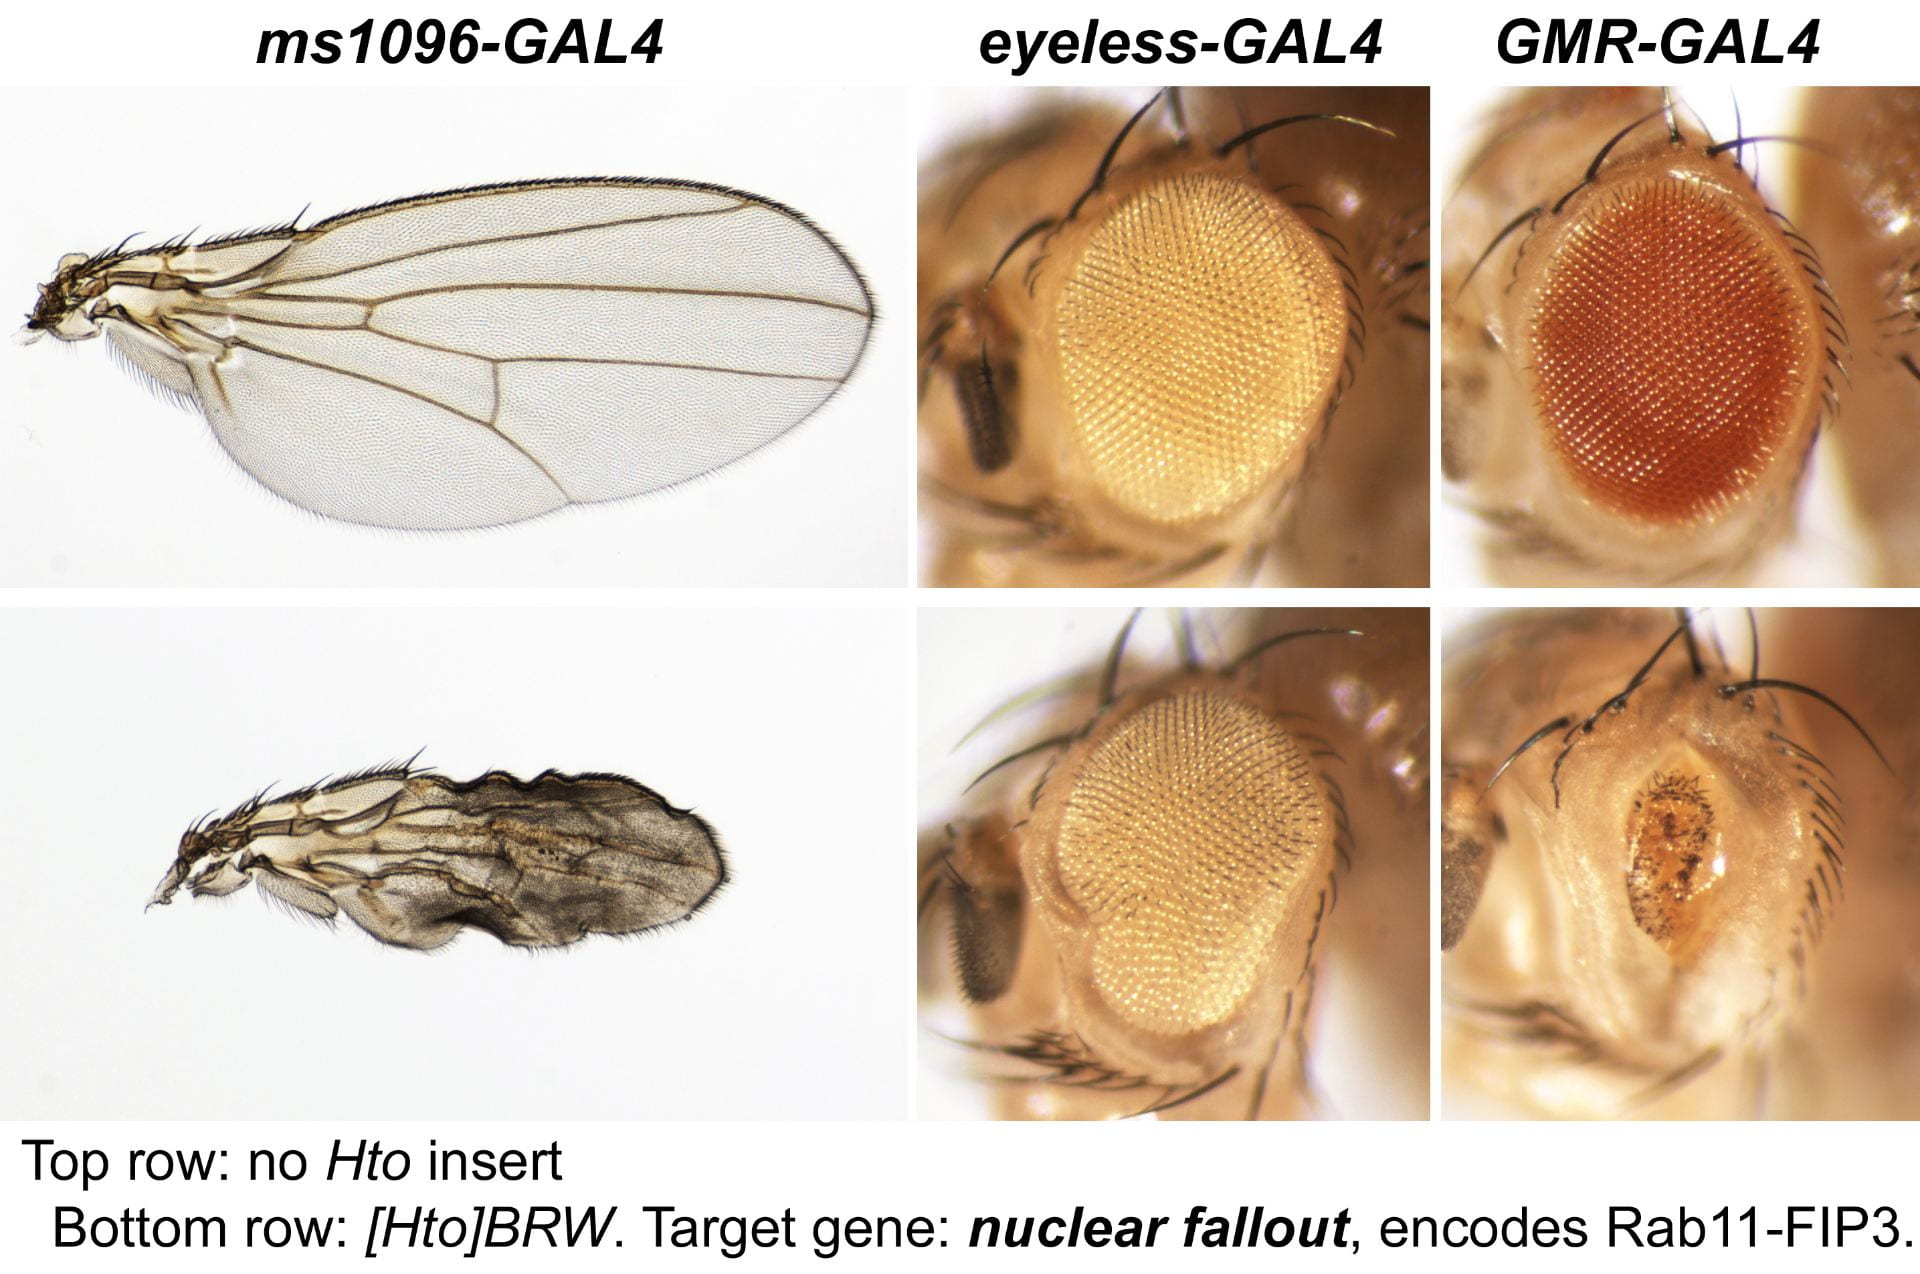 | 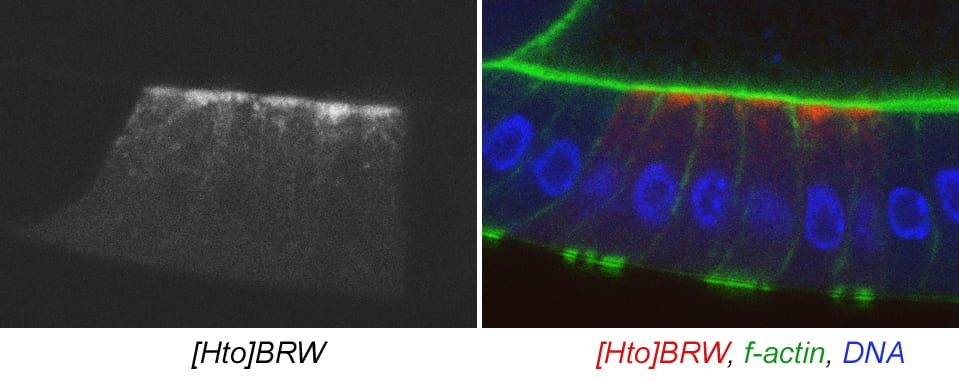 |
| WGL. TfAP-2. | transcription factor | 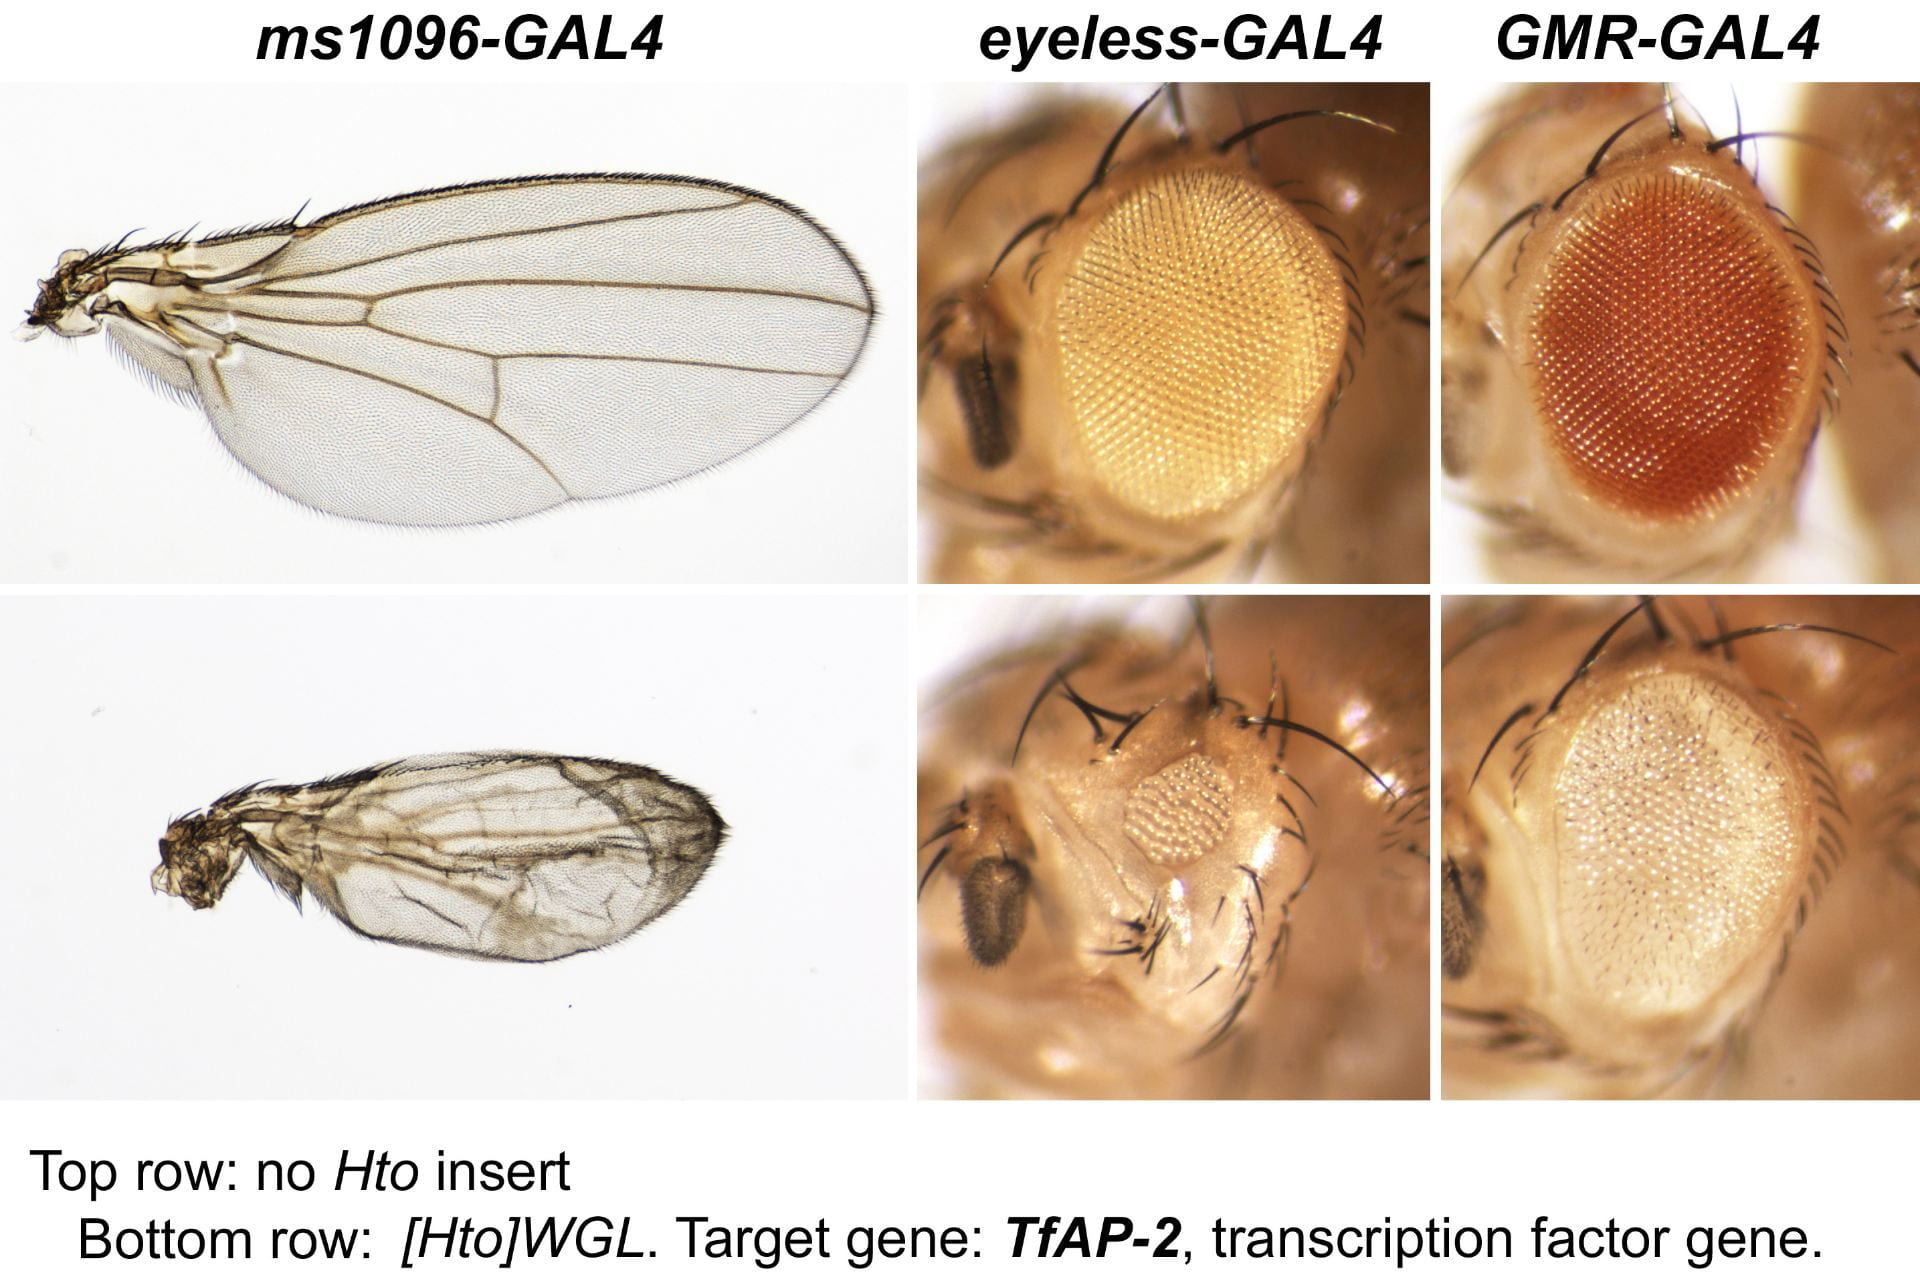 | |
| GYB. Synaptotagmin 4. | Synaptotagmin | | 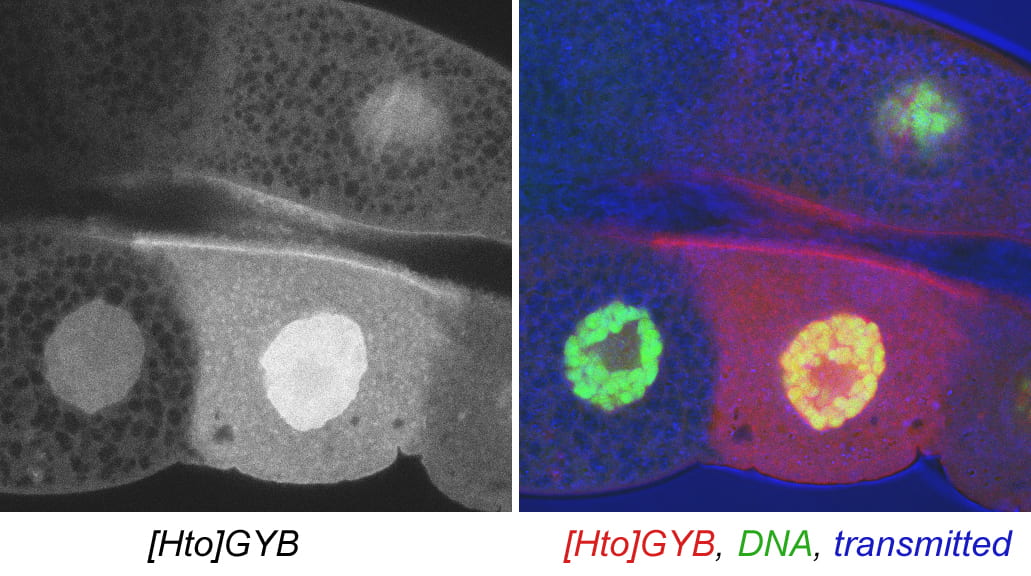 |
| DPQ. pumilio. | RNA binding protein | 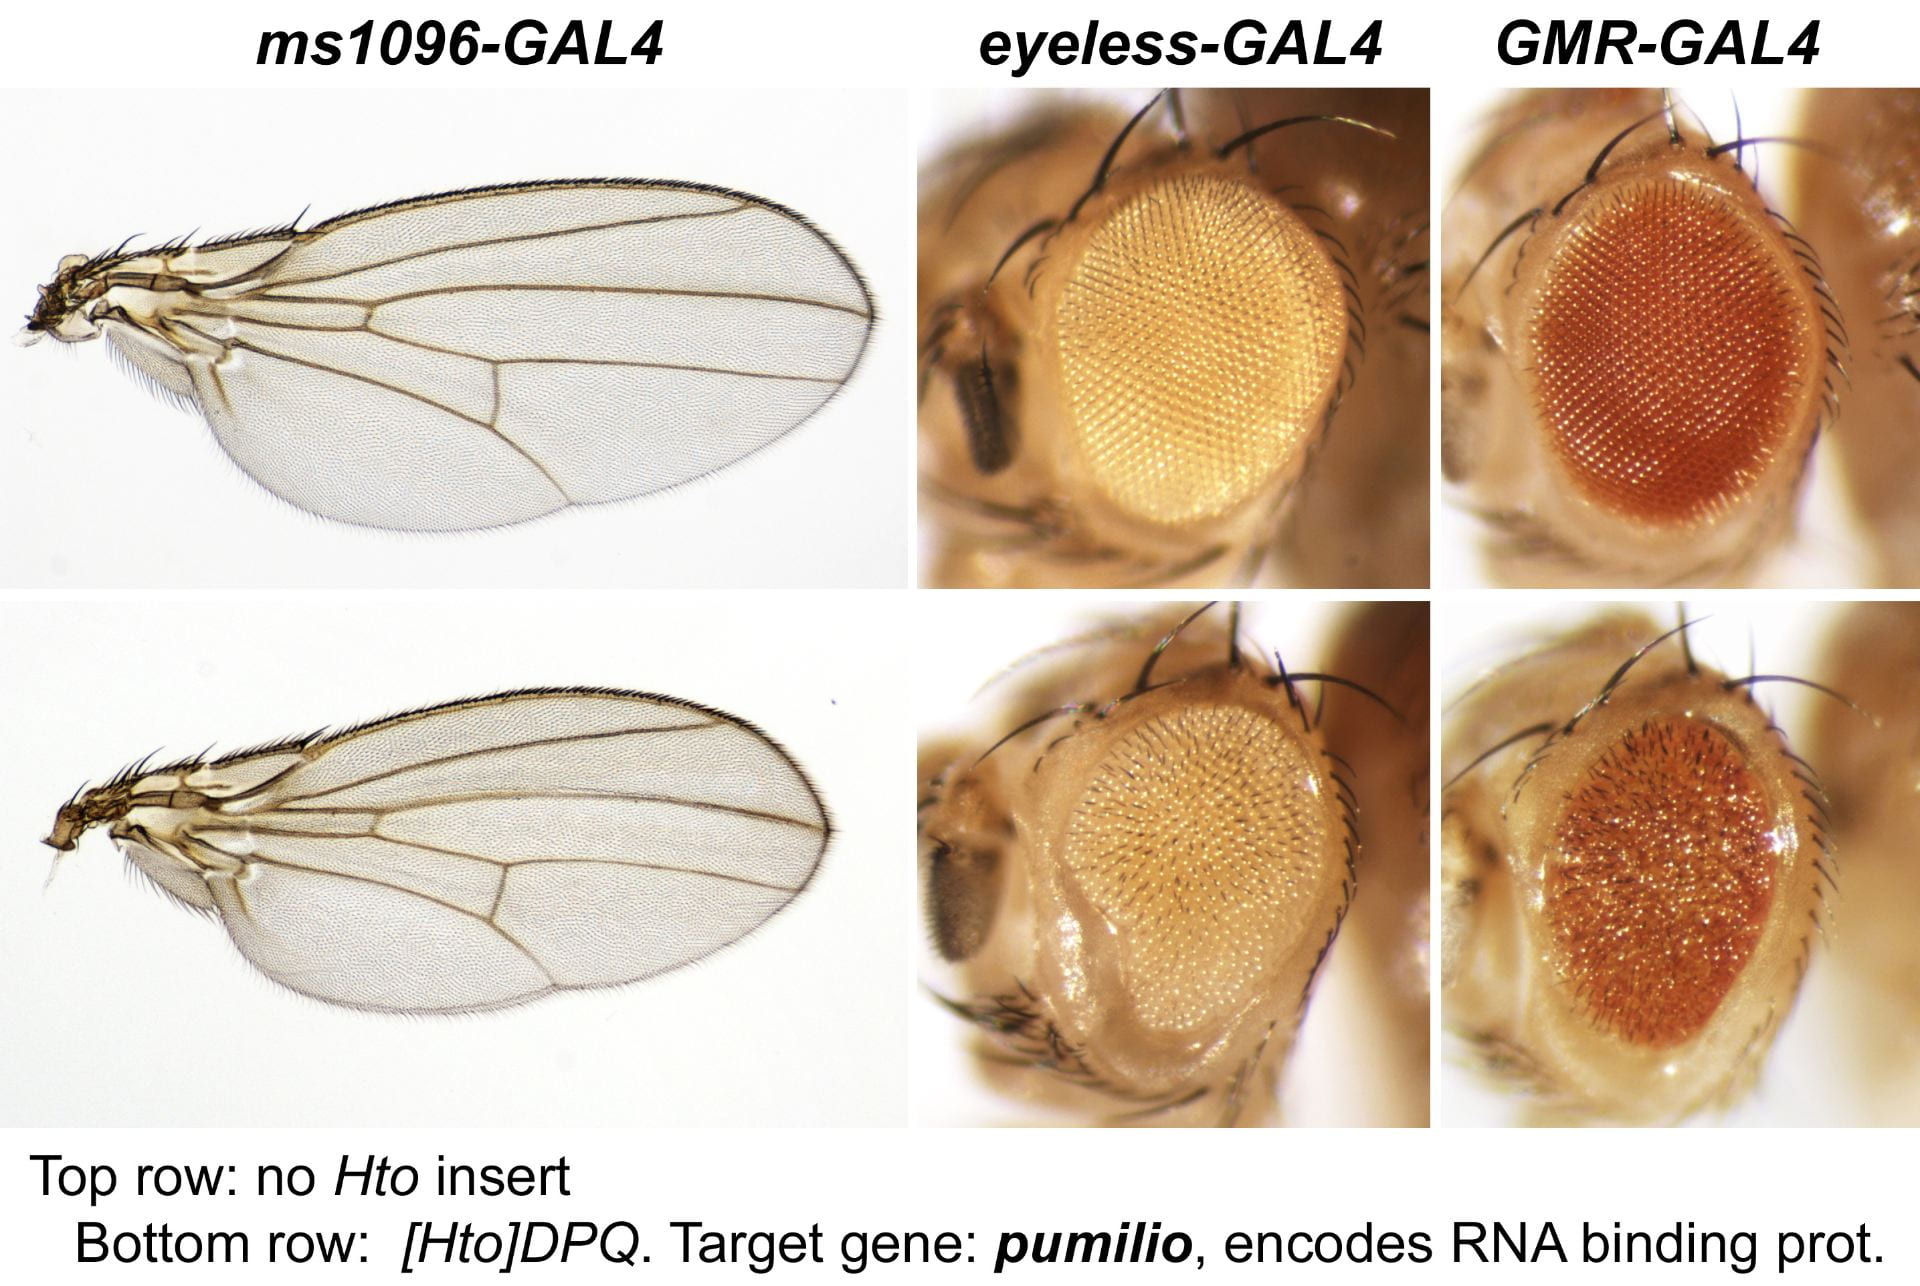 | |
| GER. pumilio. | RNA binding protein | | |
| WEB. pumilio. | RNA binding protein | | |
| GTA. taranis. | SERTA Domain | | |
| QBP. taranis. | SERTA Domain |  | |
| LNP. iab-8, abd-A. | ncRNA | | |
| QYE. bonus. | TRIM24 homolog | 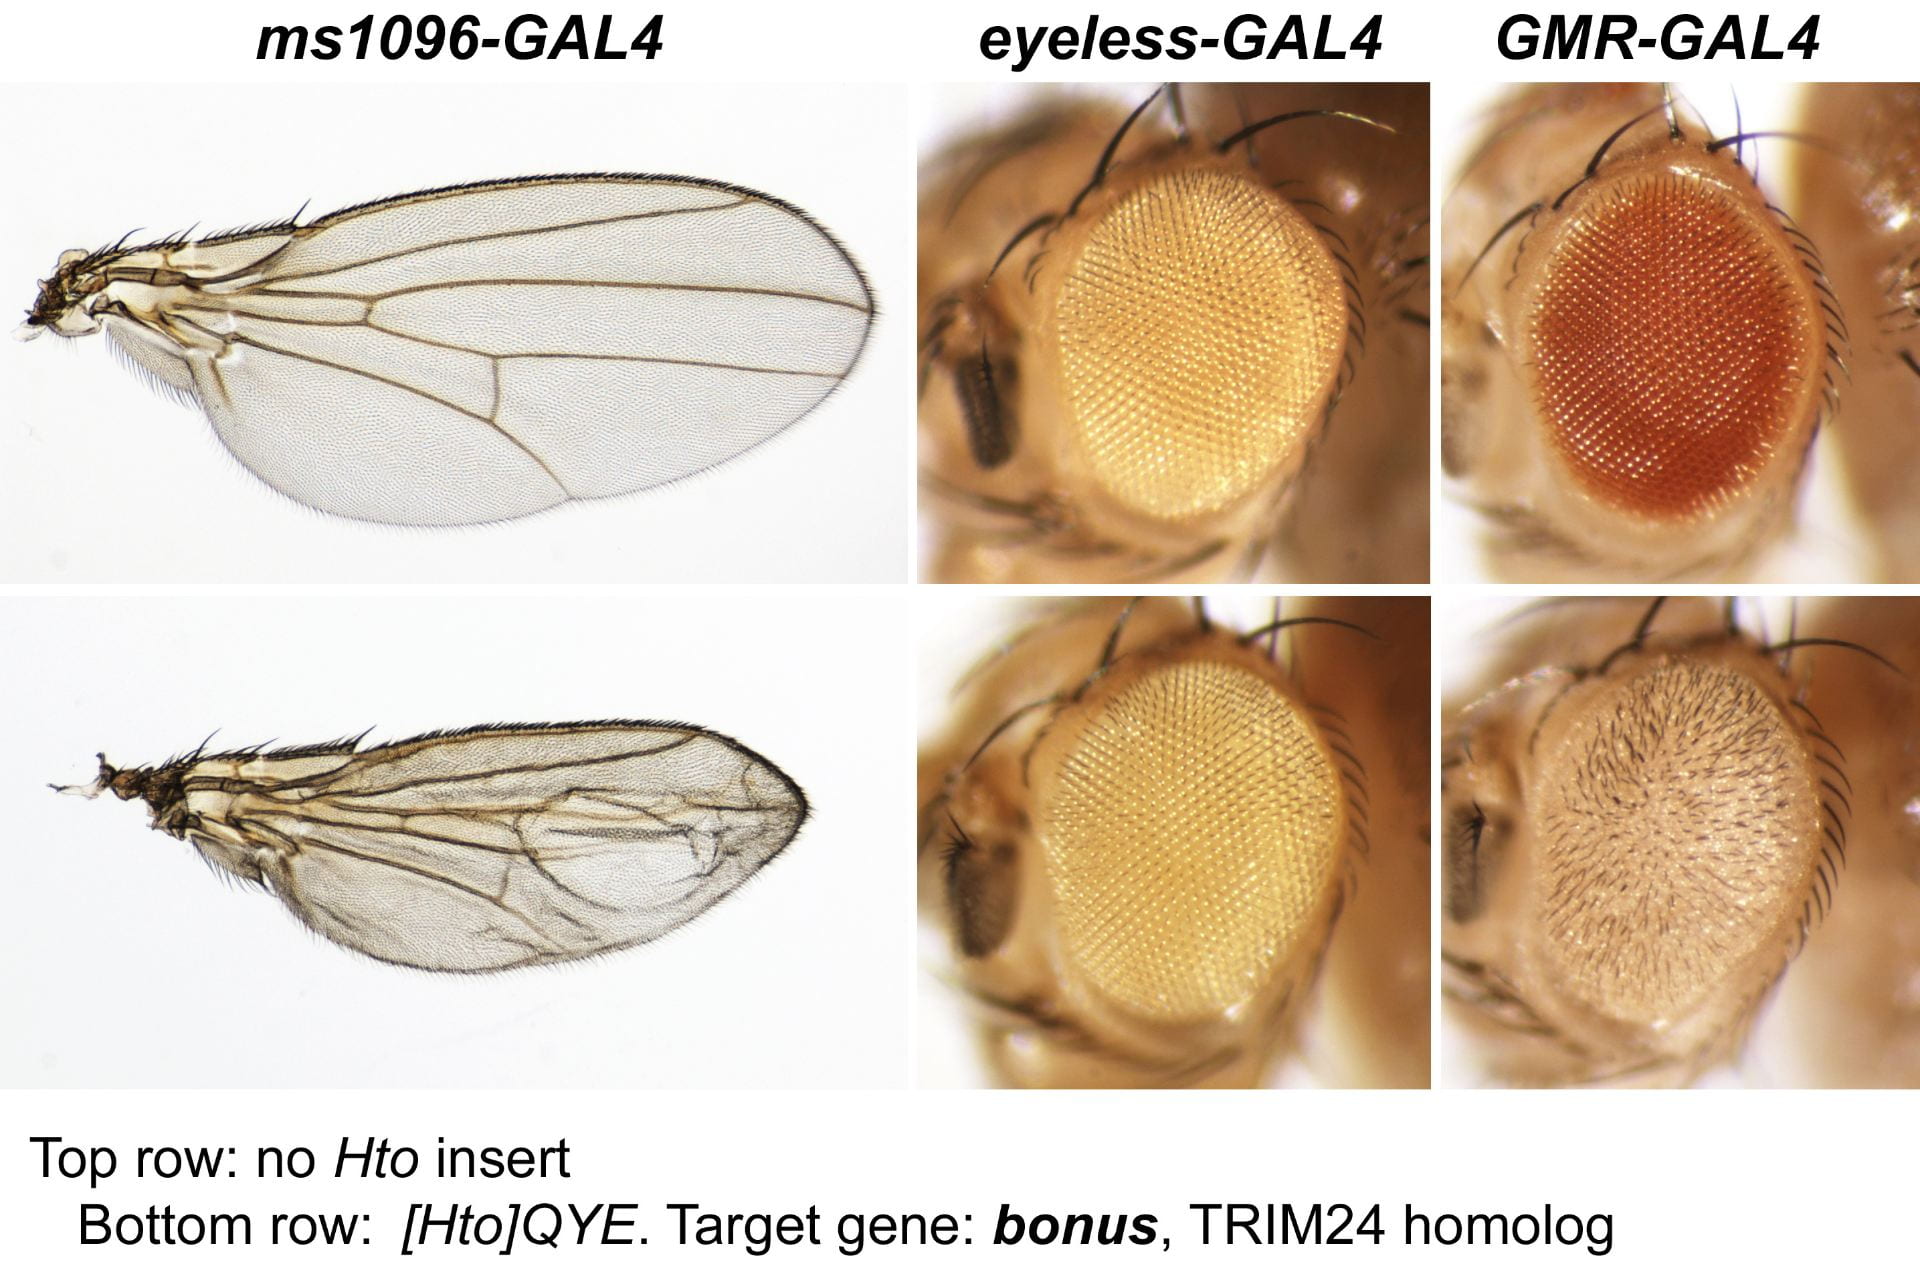 |  |
| KCM. CG42235. | homolog of SLC5A8 solute transporter | 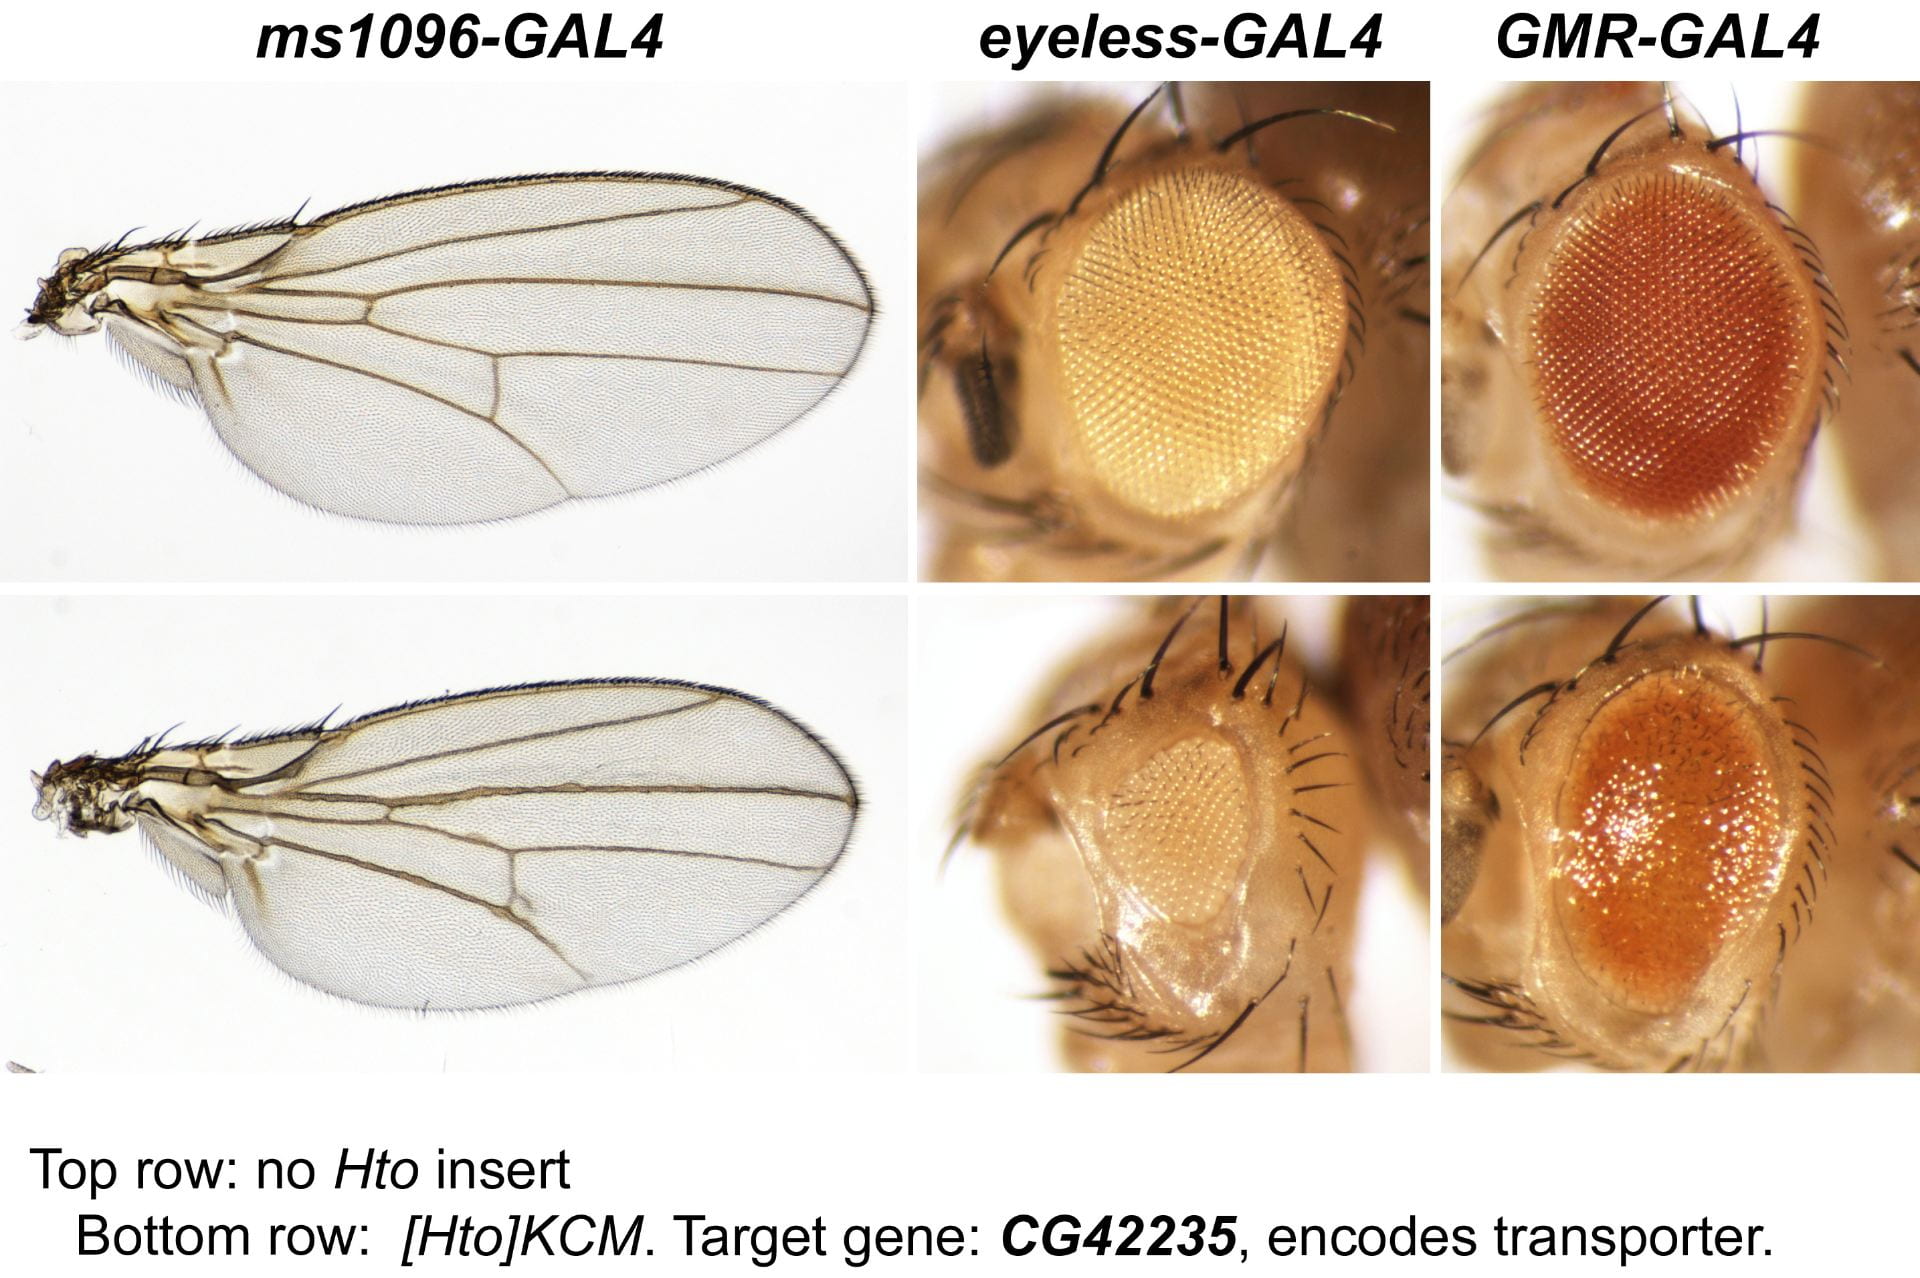 | |
| EAB. zfh2. | transcription factor | | |
| HJF. Sox102F. | transcription factor | 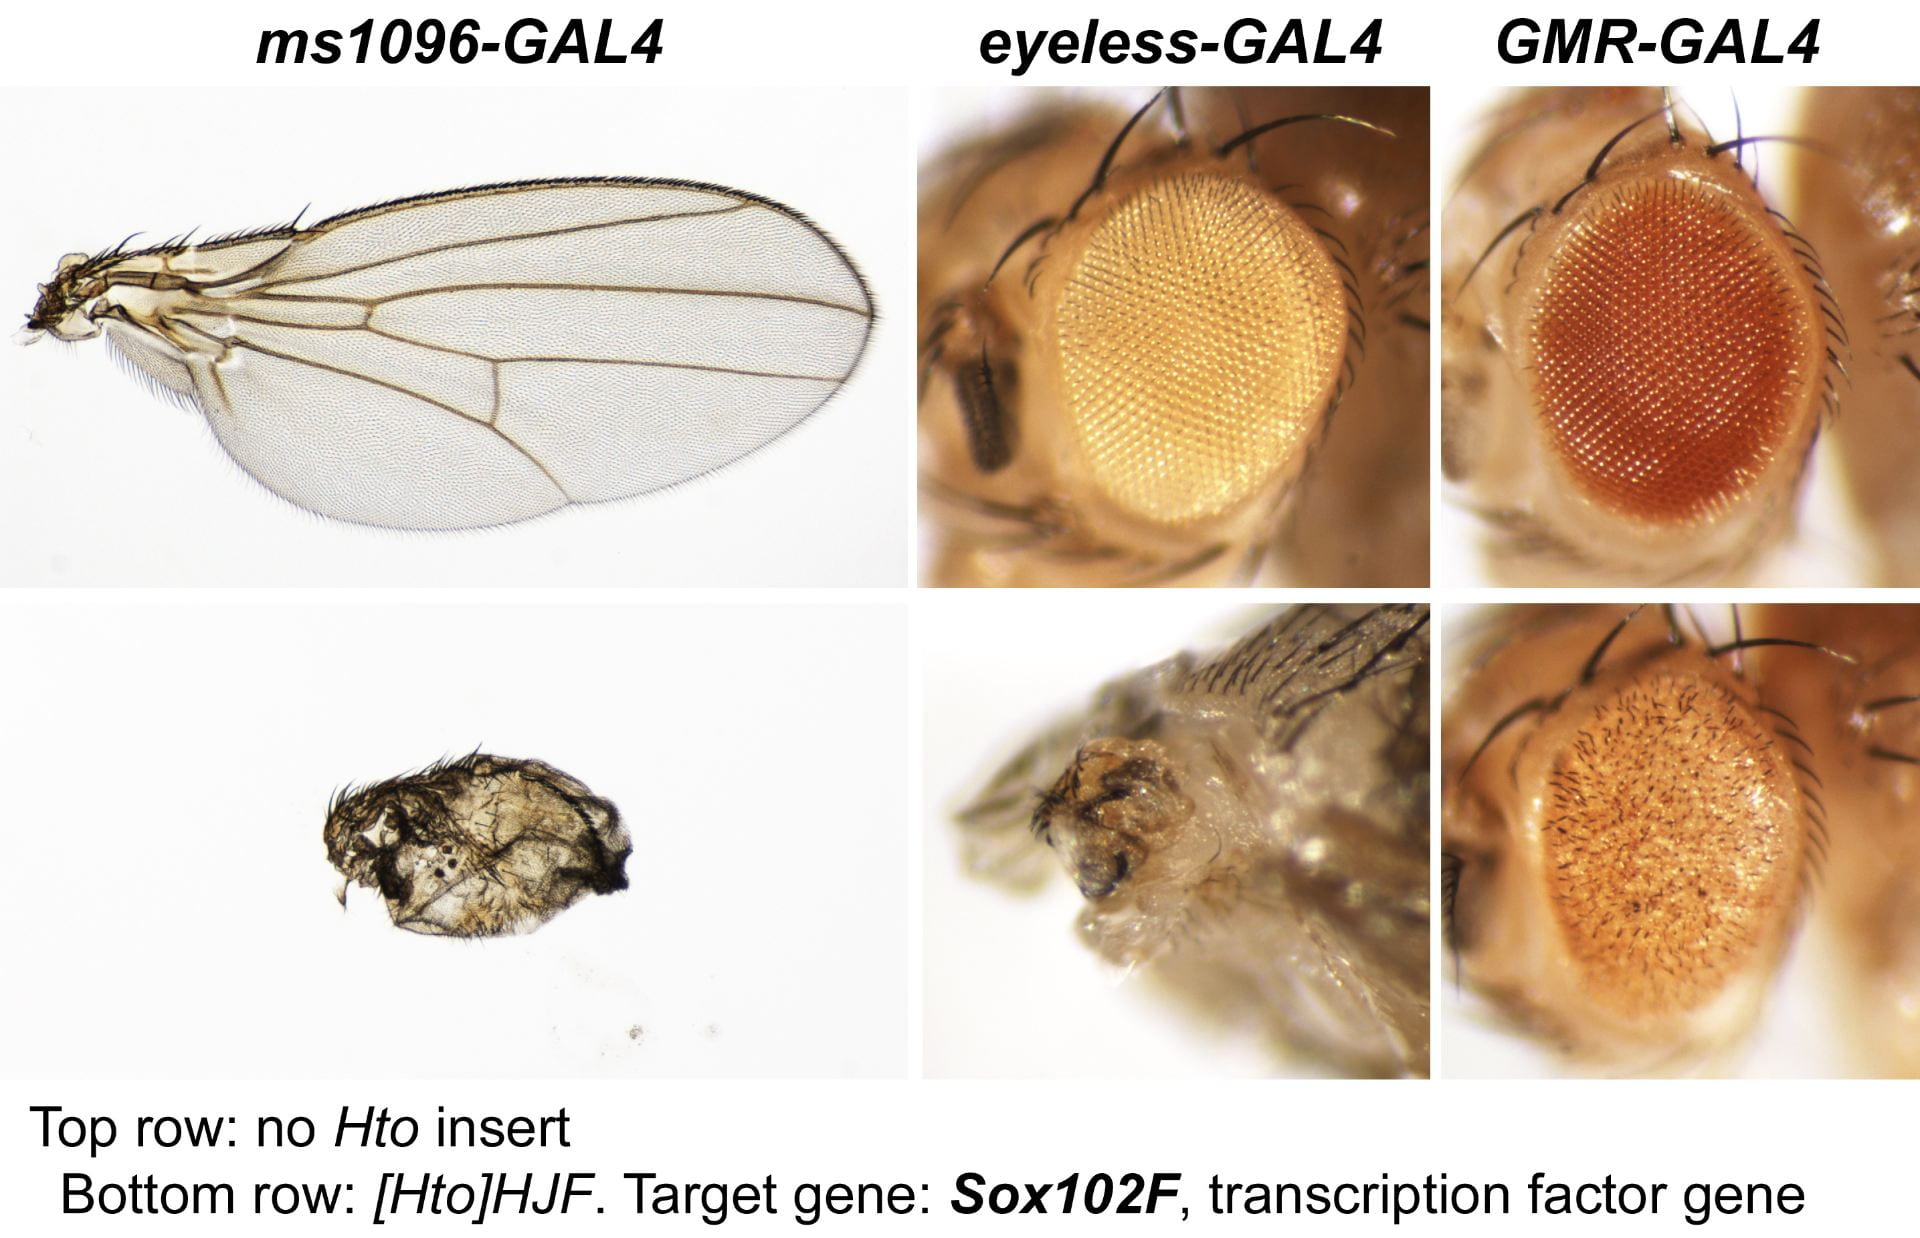 | 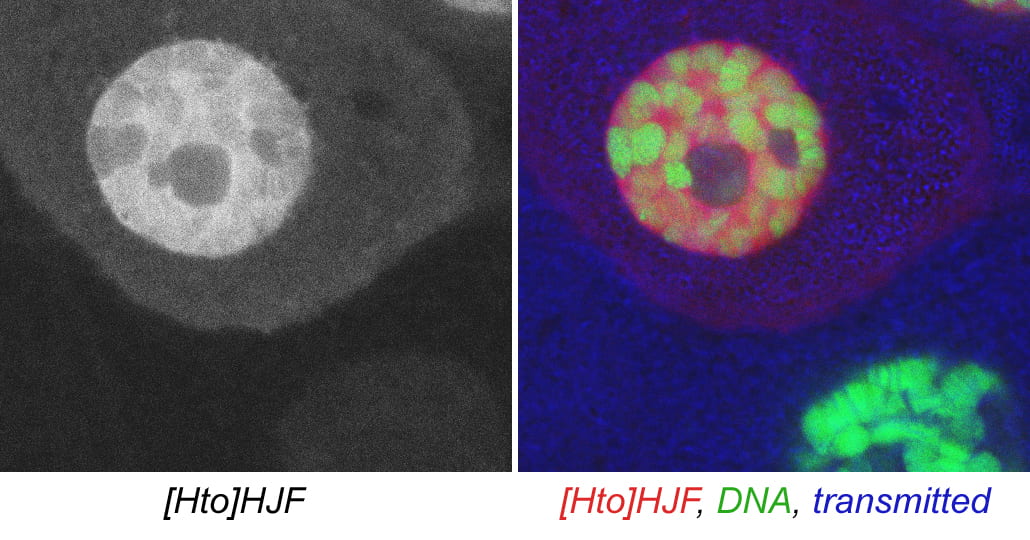 |
| OMD. shaven. | D-Pax2, Paired box transcription factor |  | |
Each Hto insert is given a unique 3-letter identifier (note this not a gene name; use italic and all caps). Each insert lies within or upstream of its target gene.Table: Column 1 lists the insert and the target gene (linked to its FlyBase page). Column 2 is the protein (or RNA) product. Column 3 is a summary of adult phenotypes (see below). Column 4 contains other images or data.
Molecular data
The full molecular data, as well as other aspects of genetics and phenotypes, are best obtained from our master Excel spreadsheet.The current spreadsheet is available as supplement file Table S1 of our Genetics paper, Singari et al.; updated versions will also be posted here.
Phenotypic data
After a new line is recovered and isogenized, we cross it to a set of three drivers to get a profile of its phenotypic effects. We express in the wing blade with ms1096w-GAL4 (an insert in Beadex) to assess the effects on epithelial development. Eye phenotypes are characterized with eyeless-GAL4 (early eye development) and GMR-GAL4 (late eye development). Some lines were also crossed to pnr-GAL4 and A101-GAL4. The set of ms1096/ey/GMR images for each line are provided in the table above. It is notable that each line gives a unique combination of phenotypes with these three drivers, indicating they each execute a different biological activity.
Microscopy data
The subcellular distribution for a subset of lines was shown in Singari et al. Additional confocal images will be posted here periodically; the methods and stains for these are as described in Singari et al. The mCherry RFP signal is generally shown in original contrast (no sigma curve), except in the case of polytene spreads, where the contrast is enhanced in order to see the RFP signal clearly along with the SYBR Green DNA signal.